Supported by Dr. Osamu Ogasawara and  . . |
|
Last data update: 2014.03.03 |
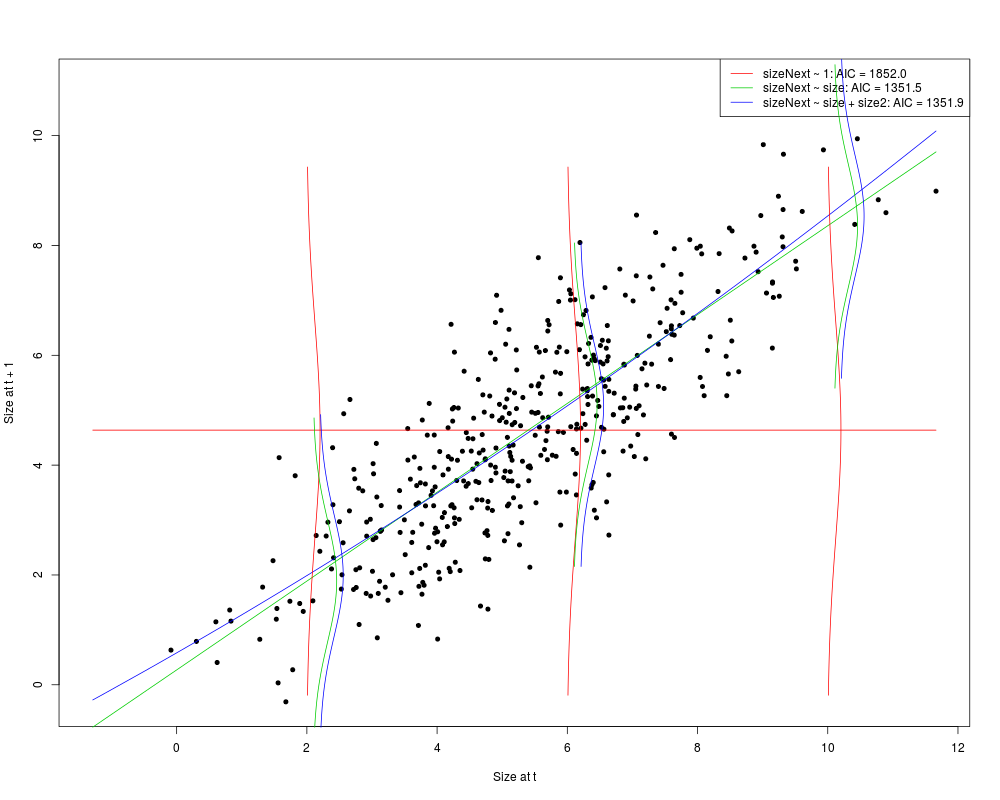
Adds probability density functions of density function of size or increment given current size and growth to plots.DescriptionFunction generates pdfs (probability density functions) corresponding to chosen sizes and adds them to a figure using growth methods. Usage
addPdfGrowthPic(respType = "sizeNext", sizesPlotAt = c(20, 50, 60),
                            sizeRange = c(20, 400), incrRange = c(-10, 50),
                            scalar = 100, growthObjList,
                            cols = 1:5,
                            cov = data.frame(covariate=1),
                            minShow = 1e-2,
                            jitt = 2,
                            ...)
Arguments
Valuenone Author(s)C. Jessica E. Metcalf, Sean M. McMahon, Roberto Salguero-Gomez, Eelke Jongejans & Cory Merow. See Also
Examples# Data with size and sizeNext dff <- generateData() a1 <- growthModelComp(dff, makePlot = TRUE) addPdfGrowthPic(respType = "sizeNext", sizesPlotAt = c(2, 6, 10), scalar = 1, jitt = 0.1, sizeRange = c(-5, 25), growthObjList = a1$growthObjects, cols = 2:5) Results
R version 3.3.1 (2016-06-21) -- "Bug in Your Hair"
Copyright (C) 2016 The R Foundation for Statistical Computing
Platform: x86_64-pc-linux-gnu (64-bit)

R is free software and comes with ABSOLUTELY NO WARRANTY.
You are welcome to redistribute it under certain conditions.
Type 'license()' or 'licence()' for distribution details.

R is a collaborative project with many contributors.
Type 'contributors()' for more information and
'citation()' on how to cite R or R packages in publications.

Type 'demo()' for some demos, 'help()' for on-line help, or
'help.start()' for an HTML browser interface to help.
Type 'q()' to quit R.

> library(IPMpack)
Loading required package: Matrix
Loading required package: MASS
Loading required package: nlme
> png(filename="/home/ddbj/snapshot/RGM3/R_CC/result/IPMpack/addPdfGrowthPic.Rd_%03d_medium.png", width=480, height=480)
> ### Name: addPdfGrowthPic
> ### Title: Adds probability density functions of density function of size
> ###   or increment given current size and growth to plots.
> ### Aliases: addPdfGrowthPic
>
> ### ** Examples
>
> # Data with size and sizeNext
> dff <- generateData()
>
> a1 <- growthModelComp(dff, makePlot = TRUE)
> addPdfGrowthPic(respType = "sizeNext",
+ 	sizesPlotAt = c(2, 6, 10), scalar = 1, jitt = 0.1,
+ 		sizeRange = c(-5, 25),
+ 			growthObjList = a1$growthObjects, cols = 2:5)
Warning message:
In log(incr) : NaNs produced
>
>
>
>
>
>
> dev.off()
null device
          1
>
|