Supported by Dr. Osamu Ogasawara and  . . |
|
Last data update: 2014.03.03 |
Calculates population growth rate (lambda) and stable stage distribution in a computationally efficient way when the number of bins in the IPM is large.DescriptionMethod to calculate population growth rate (lambda) and stable stage distribution where a large number of bins are used in the IPM, as it may be the case with species that vary largely in size, or models that include size x age interactions. UsagelargeMatrixCalc(Pmatrix, Fmatrix, tol = 1e-08) Arguments
Value
NoteModified from Appendix A in Rees and Ellner 2009 (see references). Author(s)C. Jessica E. Metcalf, Sean M. McMahon, Roberto Salguero-Gomez, Eelke Jongejans & Cory Merow. ReferencesRees and Ellner. 2009. Integral projection models for populations in temporally varying environments. The American Naturalist 79, p575-594. Caswell. 2001. Matrix population models: construction, analysis, and interpretation. 2nd ed. Sinauer. p377-502. Garcia, Dahlgren, Ehrlen. 2011. No evidence of senescence in a 300-year-old mountain herb. Journal of Ecology 99, p1424-1430. Examples
dff <- generateData()
Pmatrix <- makeIPMPmatrix(minSize = min(dff$size, na.rm = TRUE),
maxSize = max(dff$size, na.rm = TRUE), growObj = makeGrowthObj(dff),
survObj = makeSurvObj(dff))
Fmatrix <- makeIPMFmatrix(minSize = min(dff$size, na.rm = TRUE),
maxSize = max(dff$size, na.rm = TRUE),fecObj = makeFecObj(dff))
largeMatrixCalc(Pmatrix, Fmatrix)
par(mfrow=c(1,2),pty="s")
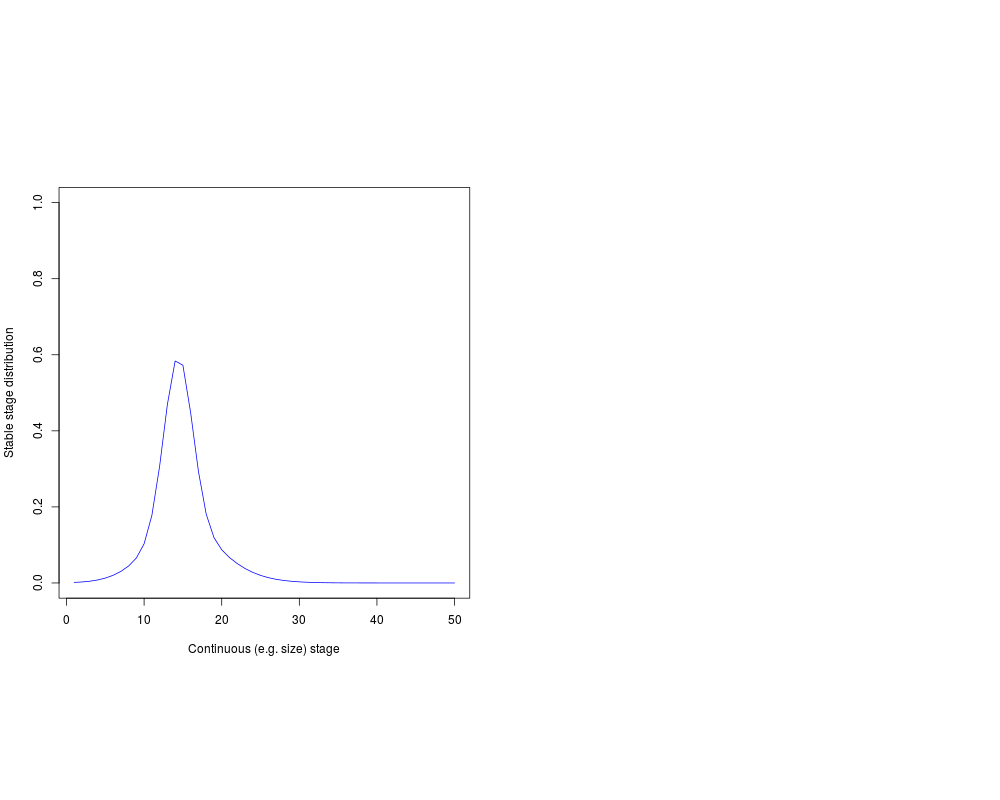
plot(largeMatrixCalc(Pmatrix, Fmatrix)$stableDist,
ylab = "Stable stage distribution",
xlab = "Continuous (e.g. size) stage",
type = "l", col = "blue", lty = 1, ylim = c(0:1))
#Note that this will not always run - as tolerance levels
# for convergence are set to be quite high
#plot(largeMatrixCalc(Pmatrix, Fmatrix)$reprodValue,
# ylab = "Reproductive value",
# xlab = "Continuous (e.g. size) stage", type = "l", col = "red",
# lty = 1, ylim = c(0:1))
Results
R version 3.3.1 (2016-06-21) -- "Bug in Your Hair"
Copyright (C) 2016 The R Foundation for Statistical Computing
Platform: x86_64-pc-linux-gnu (64-bit)

R is free software and comes with ABSOLUTELY NO WARRANTY.
You are welcome to redistribute it under certain conditions.
Type 'license()' or 'licence()' for distribution details.

R is a collaborative project with many contributors.
Type 'contributors()' for more information and
'citation()' on how to cite R or R packages in publications.

Type 'demo()' for some demos, 'help()' for on-line help, or
'help.start()' for an HTML browser interface to help.
Type 'q()' to quit R.

> library(IPMpack)
Loading required package: Matrix
Loading required package: MASS
Loading required package: nlme
> png(filename="/home/ddbj/snapshot/RGM3/R_CC/result/IPMpack/largeMatrixCalc.Rd_%03d_medium.png", width=480, height=480)
> ### Name: largeMatrixCalc
> ### Title: Calculates population growth rate (lambda) and stable stage
> ###   distribution in a computationally efficient way when the number of
> ###   bins in the IPM is large.
> ### Aliases: largeMatrixCalc
>
> ### ** Examples
>
> dff <- generateData()
> Pmatrix <- makeIPMPmatrix(minSize = min(dff$size, na.rm = TRUE),
+ 	maxSize = max(dff$size, na.rm = TRUE), growObj = makeGrowthObj(dff),
+ 	  survObj = makeSurvObj(dff))
> Fmatrix <- makeIPMFmatrix(minSize = min(dff$size, na.rm = TRUE),
+ 	maxSize = max(dff$size, na.rm = TRUE),fecObj = makeFecObj(dff))
[1] "Warning: fertility values < 0 exist in matrix, consider transforms. Negative values set to zero"
>
> largeMatrixCalc(Pmatrix, Fmatrix)
Convergence:  3.246384e-09  should be less than  1e-08
$lam
[1] 0.6680033

$stableDist
              [,1]
 [1,] 6.278061e-04
 [2,] 1.223031e-03
 [3,] 2.303199e-03
 [4,] 4.185783e-03
 [5,] 7.323701e-03
 [6,] 1.230214e-02
 [7,] 1.978521e-02
 [8,] 3.042876e-02
 [9,] 4.508065e-02
[10,] 6.681212e-02
[11,] 1.075956e-01
[12,] 1.941683e-01
[13,] 3.446691e-01
[14,] 5.093763e-01
[15,] 5.736227e-01
[16,] 4.847633e-01
[17,] 3.233851e-01
[18,] 1.949245e-01
[19,] 1.265893e-01
[20,] 9.318443e-02
[21,] 7.192231e-02
[22,] 5.480685e-02
[23,] 4.057771e-02
[24,] 2.919878e-02
[25,] 2.048474e-02
[26,] 1.404952e-02
[27,] 9.435950e-03
[28,] 6.209642e-03
[29,] 4.003014e-03
[30,] 2.525706e-03
[31,] 1.558034e-03
[32,] 9.386086e-04
[33,] 5.516617e-04
[34,] 3.160694e-04
[35,] 1.764104e-04
[36,] 9.586589e-05
[37,] 5.069984e-05
[38,] 2.608443e-05
[39,] 1.305071e-05
[40,] 6.347796e-06
[41,] 3.000644e-06
[42,] 1.378109e-06
[43,] 6.147676e-07
[44,] 2.663055e-07
[45,] 1.119879e-07
[46,] 4.570355e-08
[47,] 1.809493e-08
[48,] 6.946835e-09
[49,] 2.584462e-09
[50,] 9.309971e-10

$h1
[1] 0.2941779

>
> par(mfrow=c(1,2),pty="s")
>
> plot(largeMatrixCalc(Pmatrix, Fmatrix)$stableDist,
+     ylab = "Stable stage distribution",
+ 	xlab = "Continuous (e.g. size) stage",
+ 	type = "l", col = "blue", lty = 1, ylim = c(0:1))
Convergence:  3.246384e-09  should be less than  1e-08
>
> #Note that this will not always run - as tolerance levels
> # for convergence are set to be quite high
> #plot(largeMatrixCalc(Pmatrix, Fmatrix)$reprodValue,
> #    ylab = "Reproductive value",
> #	xlab = "Continuous (e.g. size) stage", type = "l", col = "red",
> #    lty = 1, ylim = c(0:1))
>
>
>
>
>
>
> dev.off()
null device
          1
>
|