Supported by Dr. Osamu Ogasawara and  . . |
|
Last data update: 2014.03.03 |
Estimates variation in passage time.DescriptionFunction to take a P matrix (either compound or not) and estimate variance in passage time to a chosen continuous stage value. UsagevarPassageTime(chosenSize, IPMmatrix) Arguments
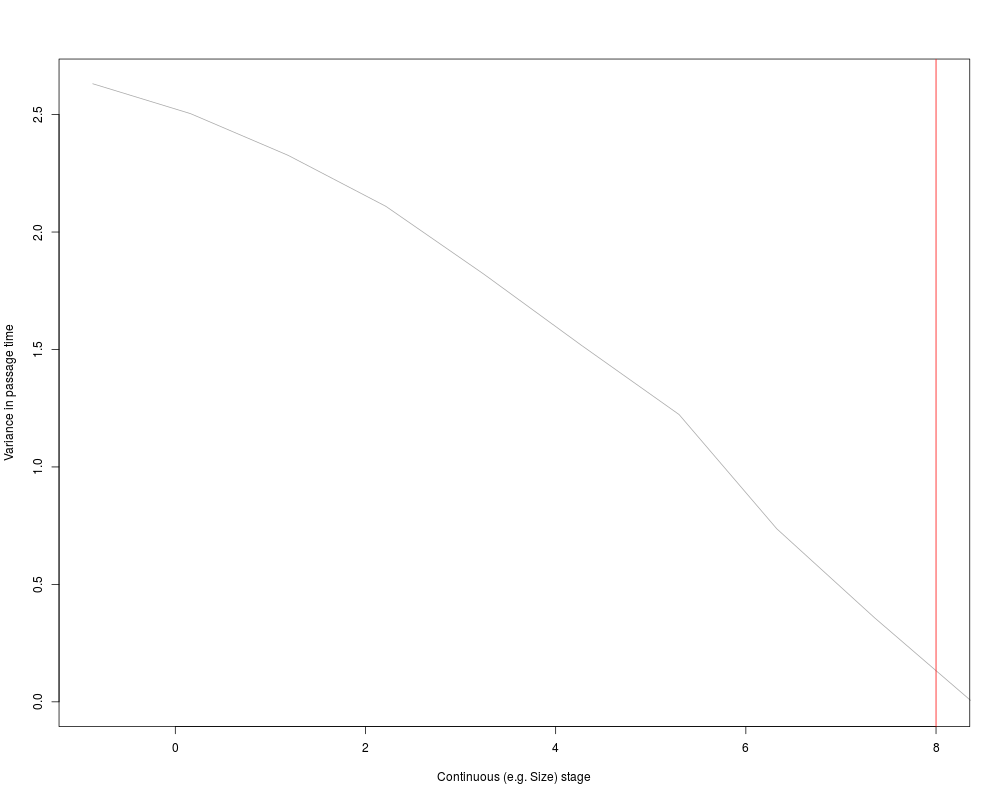
DetailsNote how variation in passage time for values exactly equal to the chosen size (targetSize) are low, because of way the conditionals are framed. Passage time from values > than targetSize should be ignored (space to the right of the red vertical line in example below), unless dealing with an organism that is able to display retrogression. ValueNumeric vector corresponding to variance in passage time from each of the meshpoints in the IPM (so both size, and if a compound matrix, size from different environments). Author(s)C. Jessica E. Metcalf, Sean M. McMahon, Roberto Salguero-Gomez, Eelke Jongejans & Cory Merow. ReferencesCaswell, 2001. Matrix population models: analysis, construction and interpretation. 2nd ed. Sinauer. p119. Metcalf, Horvitz, Tuljapurkar & Clark. 2009. A time to grow and a time to die: a new way to analyze the dynamics of size, light, age and death of tropical trees. Ecology 90, p2766-2778. For bias in this estimation where variance in growth is small relative to the size range: Zuidema, Jongejans, Chien, During & Schieving. 2010. Integral Projection Models for trees: a new parameterization method and a validation of model output. Journal of Ecology 98, p345-355. For species with shrinkage: Salguero-Gomez & Casper. 2010. Keeping shrinkage in the demographic loop. Journal of Ecology 98, p313-323. See Also
Examples# With continuous (e.g. size) stage dff <- generateData() Pmatrix <- makeIPMPmatrix(minSize = min(dff$size, na.rm = TRUE), maxSize <- max(dff$size, na.rm = TRUE), growObj = makeGrowthObj(dff), survObj = makeSurvObj(dff)) targetSize <- 8 vP <- varPassageTime(targetSize, Pmatrix) plot(Pmatrix@meshpoints, vP, type = "l", xlab="Continuous (e.g. Size) stage", xlim=c(Pmatrix@meshpoints[1],targetSize), ylab = "Variance in passage time", col = "dark gray") abline(v = targetSize, col = "red") ## not sure variance works with this.... Results
R version 3.3.1 (2016-06-21) -- "Bug in Your Hair"
Copyright (C) 2016 The R Foundation for Statistical Computing
Platform: x86_64-pc-linux-gnu (64-bit)

R is free software and comes with ABSOLUTELY NO WARRANTY.
You are welcome to redistribute it under certain conditions.
Type 'license()' or 'licence()' for distribution details.

R is a collaborative project with many contributors.
Type 'contributors()' for more information and
'citation()' on how to cite R or R packages in publications.

Type 'demo()' for some demos, 'help()' for on-line help, or
'help.start()' for an HTML browser interface to help.
Type 'q()' to quit R.

> library(IPMpack)
Loading required package: Matrix
Loading required package: MASS
Loading required package: nlme
> png(filename="/home/ddbj/snapshot/RGM3/R_CC/result/IPMpack/varPassageTime.Rd_%03d_medium.png", width=480, height=480)
> ### Name: varPassageTime
> ### Title: Estimates variation in passage time.
> ### Aliases: varPassageTime
>
> ### ** Examples
>
> # With continuous (e.g. size) stage
> dff <- generateData()
> Pmatrix <- makeIPMPmatrix(minSize = min(dff$size, na.rm = TRUE),
+ maxSize <- max(dff$size, na.rm = TRUE), growObj = makeGrowthObj(dff),
+ survObj = makeSurvObj(dff))
> targetSize <- 8
> vP <- varPassageTime(targetSize, Pmatrix)
>
> plot(Pmatrix@meshpoints, vP, type = "l", xlab="Continuous (e.g. Size) stage",
+ 	xlim=c(Pmatrix@meshpoints[1],targetSize),
+ 	ylab = "Variance in passage time", col = "dark gray")
> abline(v = targetSize, col = "red")
>
> ## not sure variance works with this....
>
>
>
>
>
>
>
> dev.off()
null device
          1
>
|