Supported by Dr. Osamu Ogasawara and  . . |
|
Last data update: 2014.03.03 |
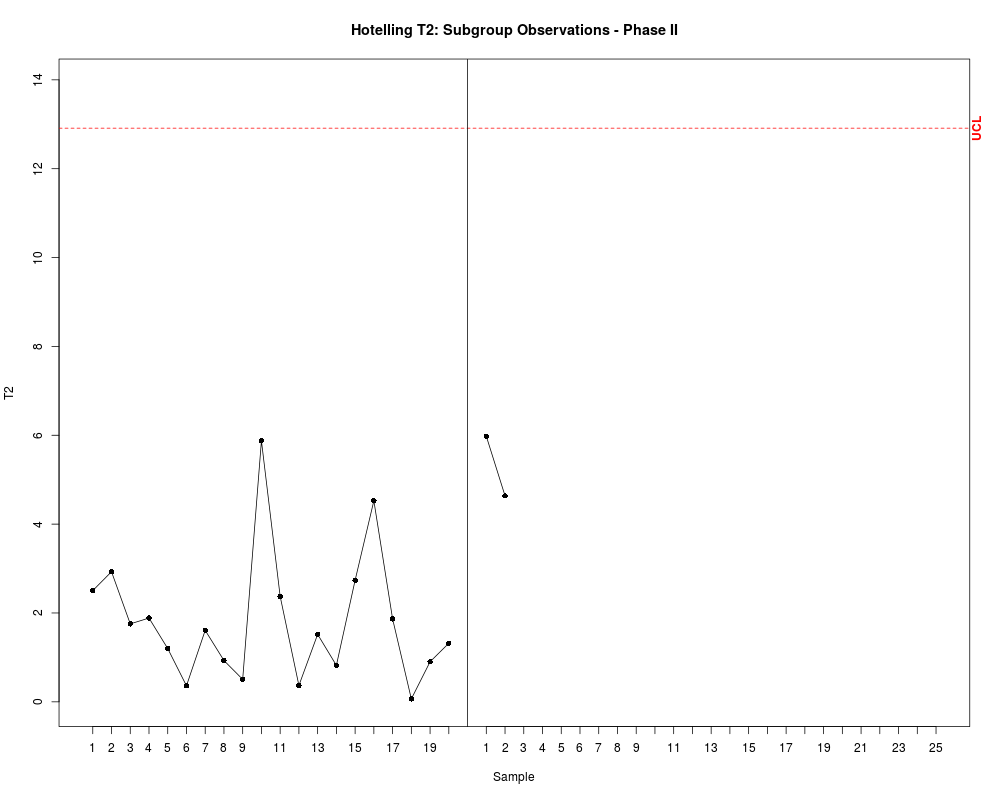
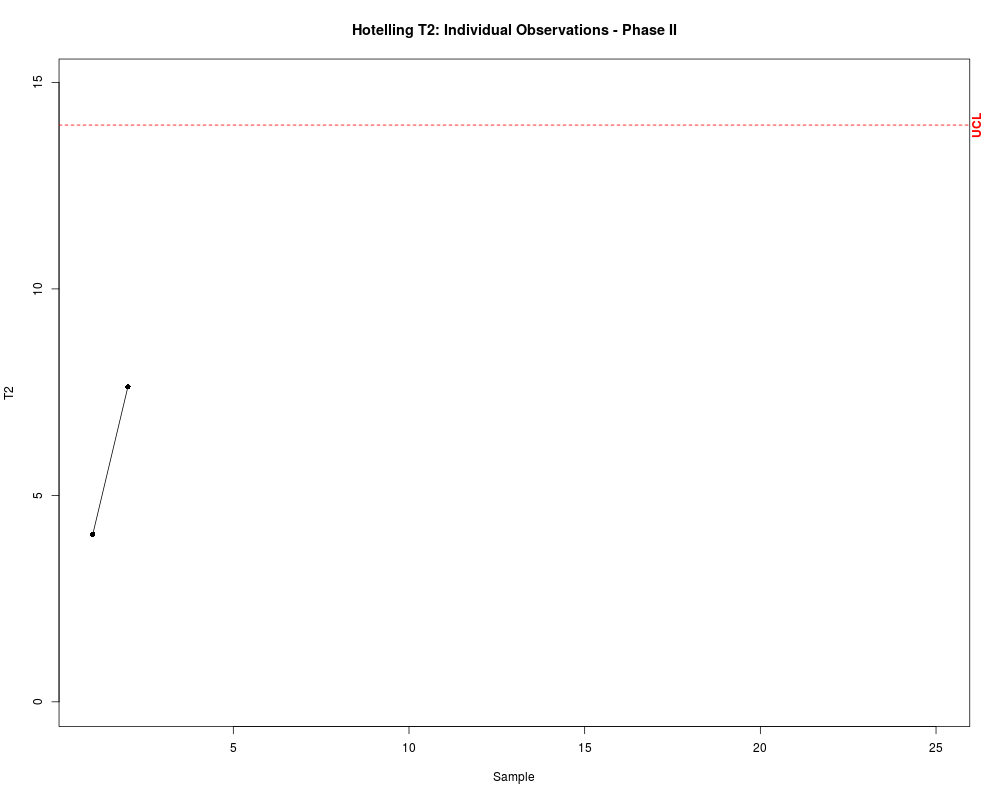
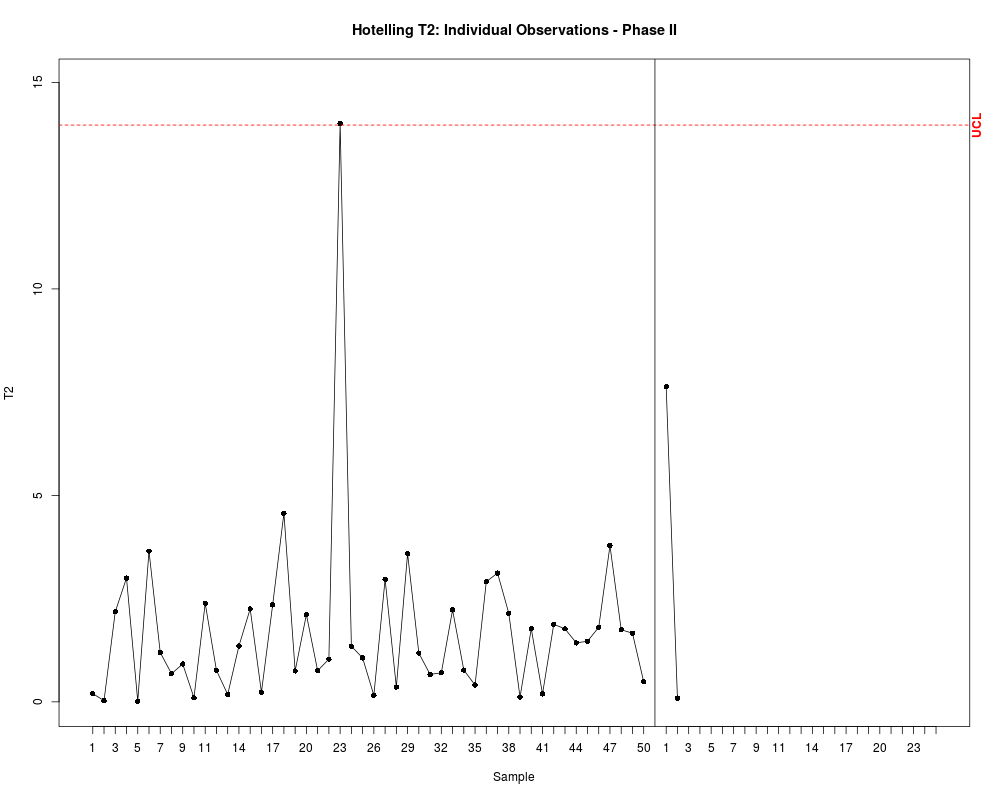
Updates the Hotelling Control Chart.DescriptionThis function is used to update the phase II control chart with new observations. Usageadd.data(datum2, estat, T2II, n, j, m = NULL) Arguments
DetailsTo use this function it is necessary to have the output given by the function T2.2. At every step you should entry with the new data set. ValueAdd the new observation to the current Hoteliing control chart for phase II. Author(s)Daniela R. Recchia, Emanuel P. Barbosa See AlsoT2.2 Examplesmu <- c(5.682, 88.22) Sigma <- symMatrix(c(3.770, -5.495, 13.53), 2) datum <- data.1(20, 10, mu, Sigma) estat <- stats(datum, 20, 10, 2) datum2 <- data.2(estat, 10, p = 2) T2II <- T2.2(datum2, estat, 10) #Not showing the phase I data set. cchart.T2.2(T2II, 20, 10, 1, 25, 2) datum3 <- data.2(estat, 10, p = 2) add.data(datum3, estat, T2II, 10, 2) #Showing the phase I data set. cchart.T2.2(T2II, 20, 10, 1, 25, 2, datum = datum) datum3 <- data.2(estat, 10, p = 2) add.data(datum3, estat, T2II, 10, 2, 20) #Example with individual observations datum <- data.1(50, 1, mu, Sigma) estat <- stats(datum, 50, 1, 2) datum2 <- data.2(estat, 1, p = 2) T2II <- T2.2(datum2, estat, 1) #Not showing the phase I data set. cchart.T2.2(T2II, 50, 1, 1, 25, 2) datum3 <- data.2(estat, 1, p = 2) add.data(datum3, estat, T2II, 1, 2) #Showing the phase I data set. cchart.T2.2(T2II, 50, 1, 1, 25, 2, datum = datum) datum3 <- data.2(estat, 1, p = 2) add.data(datum3, estat, T2II, 1, 2, 50) Results
R version 3.3.1 (2016-06-21) -- "Bug in Your Hair"
Copyright (C) 2016 The R Foundation for Statistical Computing
Platform: x86_64-pc-linux-gnu (64-bit)

R is free software and comes with ABSOLUTELY NO WARRANTY.
You are welcome to redistribute it under certain conditions.
Type 'license()' or 'licence()' for distribution details.

R is a collaborative project with many contributors.
Type 'contributors()' for more information and
'citation()' on how to cite R or R packages in publications.

Type 'demo()' for some demos, 'help()' for on-line help, or
'help.start()' for an HTML browser interface to help.
Type 'q()' to quit R.

> library(IQCC)
Loading required package: qcc
Package 'qcc', version 2.6
Type 'citation("qcc")' for citing this R package in publications.
Loading required package: MASS
Loading required package: micEcon

If you have questions, suggestions, or comments regarding one of the 'micEcon' packages, please use a forum or 'tracker' at micEcon's R-Forge site:
https://r-forge.r-project.org/projects/micecon/
Loading required package: miscTools
> png(filename="/home/ddbj/snapshot/RGM3/R_CC/result/IQCC/add.data.Rd_%03d_medium.png", width=480, height=480)
> ### Name: add.data
> ### Title: Updates the Hotelling Control Chart.
> ### Aliases: add.data
>
> ### ** Examples
>
> mu <- c(5.682, 88.22)
> Sigma <- symMatrix(c(3.770, -5.495, 13.53), 2)
> datum <- data.1(20, 10, mu, Sigma)
> estat <- stats(datum, 20, 10, 2)
> datum2 <- data.2(estat, 10, p = 2)
> T2II <- T2.2(datum2, estat, 10)
> #Not showing the phase I data set.
> cchart.T2.2(T2II, 20, 10, 1, 25, 2)
> datum3 <- data.2(estat, 10, p = 2)
> add.data(datum3, estat, T2II, 10, 2)
> #Showing the phase I data set.
> cchart.T2.2(T2II, 20, 10, 1, 25, 2, datum = datum)
> datum3 <- data.2(estat, 10, p = 2)
> add.data(datum3, estat, T2II, 10, 2, 20)
>
> #Example with individual observations
> datum <- data.1(50, 1, mu, Sigma)
> estat <- stats(datum, 50, 1, 2)
> datum2 <- data.2(estat, 1, p = 2)
> T2II <- T2.2(datum2, estat, 1)
> #Not showing the phase I data set.
> cchart.T2.2(T2II, 50, 1, 1, 25, 2)
> datum3 <- data.2(estat, 1, p = 2)
> add.data(datum3, estat, T2II, 1, 2)
> #Showing the phase I data set.
> cchart.T2.2(T2II, 50, 1, 1, 25, 2, datum = datum)
> datum3 <- data.2(estat, 1, p = 2)
> add.data(datum3, estat, T2II, 1, 2, 50)
>
>
>
>
>
> dev.off()
null device
          1
>
|