Supported by Dr. Osamu Ogasawara and  . . |
|
Last data update: 2014.03.03 |
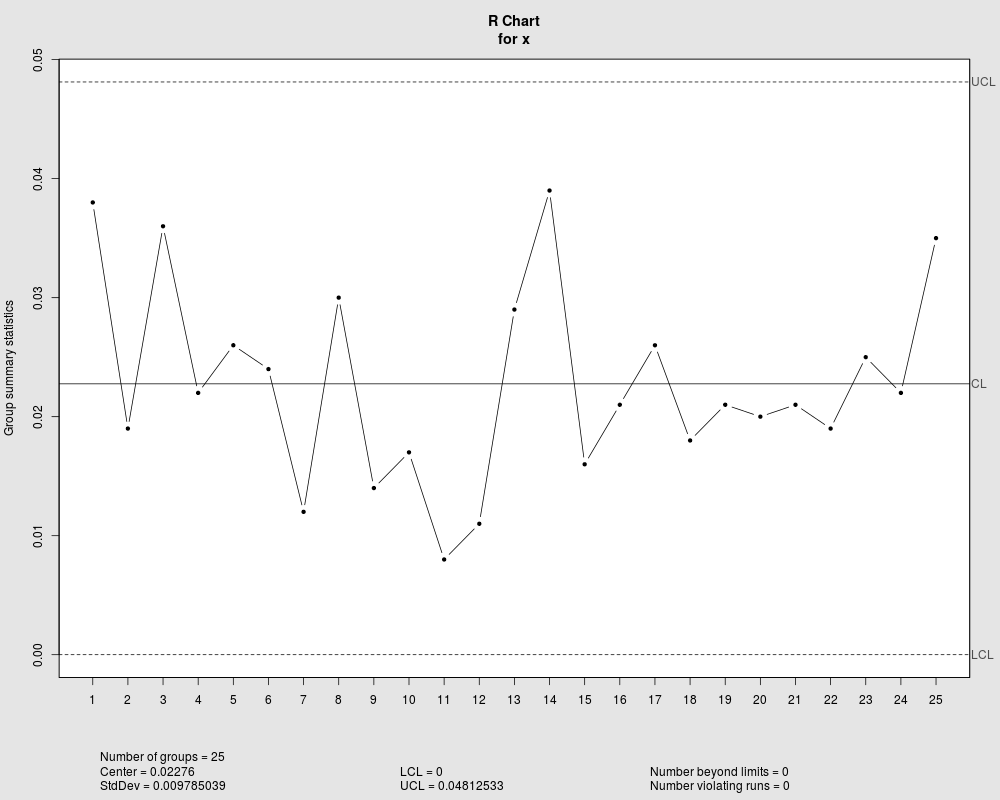
R control chartDescriptionThis function builds a R control chart. Usagecchart.R(x, n, type = "norm", y = NULL) Arguments
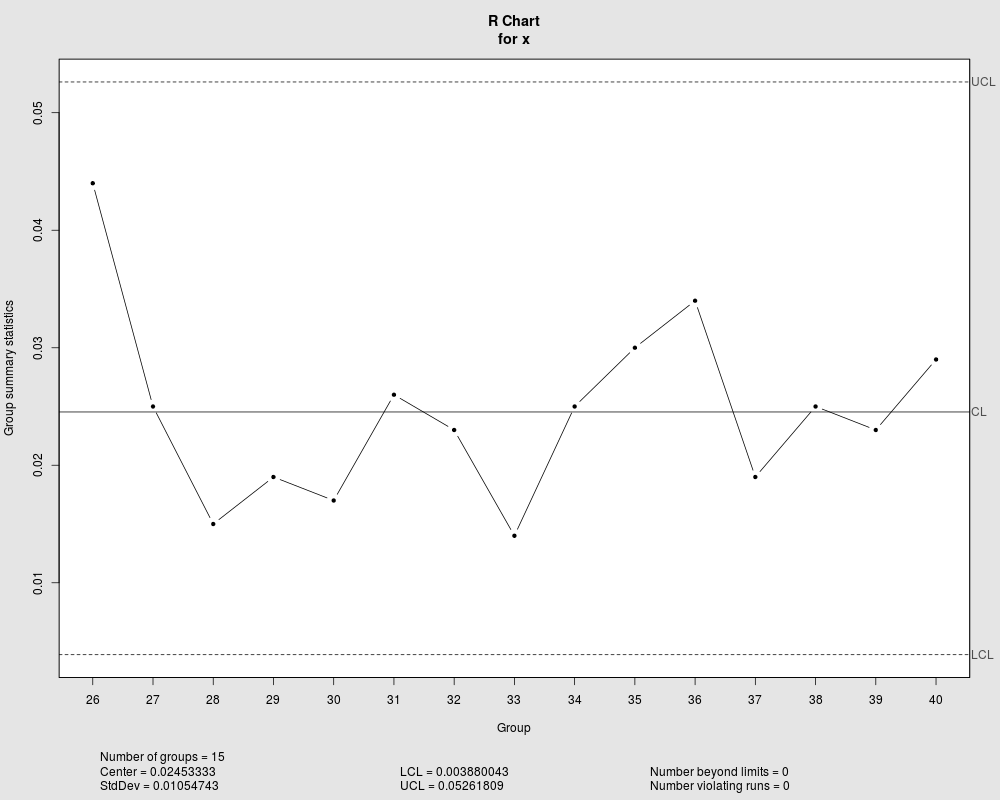
DetailsThe Shewhart R chart was designed for phase I (at this moment). The limits of the exact R chart are the alpha/2 and 1-alpha/2 quantiles of the R distribution that are calculated as estimated process sd times the quantiles of the relative range (W=R/sigma) distribution. ValueReturn a R control chart. Author(s)Daniela R. Recchia, Emanuel P. Barbosa Examplesdata(pistonrings) attach(pistonrings) cchart.R(pistonrings[1:25,], 5) cchart.R(pistonrings[26:40, ], 5, type = "tukey", pistonrings[1:25, ]) Results
R version 3.3.1 (2016-06-21) -- "Bug in Your Hair"
Copyright (C) 2016 The R Foundation for Statistical Computing
Platform: x86_64-pc-linux-gnu (64-bit)

R is free software and comes with ABSOLUTELY NO WARRANTY.
You are welcome to redistribute it under certain conditions.
Type 'license()' or 'licence()' for distribution details.

R is a collaborative project with many contributors.
Type 'contributors()' for more information and
'citation()' on how to cite R or R packages in publications.

Type 'demo()' for some demos, 'help()' for on-line help, or
'help.start()' for an HTML browser interface to help.
Type 'q()' to quit R.

> library(IQCC)
Loading required package: qcc
Package 'qcc', version 2.6
Type 'citation("qcc")' for citing this R package in publications.
Loading required package: MASS
Loading required package: micEcon

If you have questions, suggestions, or comments regarding one of the 'micEcon' packages, please use a forum or 'tracker' at micEcon's R-Forge site:
https://r-forge.r-project.org/projects/micecon/
Loading required package: miscTools
> png(filename="/home/ddbj/snapshot/RGM3/R_CC/result/IQCC/cchart.R.Rd_%03d_medium.png", width=480, height=480)
> ### Name: cchart.R.norm
> ### Title: R control chart
> ### Aliases: cchart.R
>
> ### ** Examples
>
> data(pistonrings)
> attach(pistonrings)
> cchart.R(pistonrings[1:25,], 5)
> cchart.R(pistonrings[26:40, ], 5, type = "tukey", pistonrings[1:25, ])
List of 11
 $ call      : language qcc(data = x, type = "R", limits = c(qtukey(0.00135, n, Inf) * sd.R(y),      qtukey(0.99865, n, Inf) * sd.R(y)))
 $ type      : chr "R"
 $ data.name : chr "x"
 $ data      : num [1:15, 1:5] 74 74 74 74 74 ...
  ..- attr(*, "dimnames")=List of 2
 $ statistics: Named num [1:15] 0.044 0.025 0.015 0.019 0.017 ...
  ..- attr(*, "names")= chr [1:15] "26" "27" "28" "29" ...
 $ sizes     : Named int [1:15] 5 5 5 5 5 5 5 5 5 5 ...
  ..- attr(*, "names")= chr [1:15] "26" "27" "28" "29" ...
 $ center    : num 0.0245
 $ std.dev   : num 0.0105
 $ nsigmas   : num 3
 $ limits    : num [1, 1:2] 0.00388 0.05262
  ..- attr(*, "dimnames")=List of 2
 $ violations:List of 2
 - attr(*, "class")= chr "qcc"
Warning message:
In qcc(x, type = "R", limits = c(qtukey(0.00135, n, Inf) * sd.R(y),  :
  'std.dev' is not used when limits is given
>
>
>
>
>
> dev.off()
null device
          1
>
|
Created & Maintained by Osamu Ogasawara (osamu.ogasawara@gmail.com) and 