Supported by Dr. Osamu Ogasawara and  . . |
|
Last data update: 2014.03.03 |
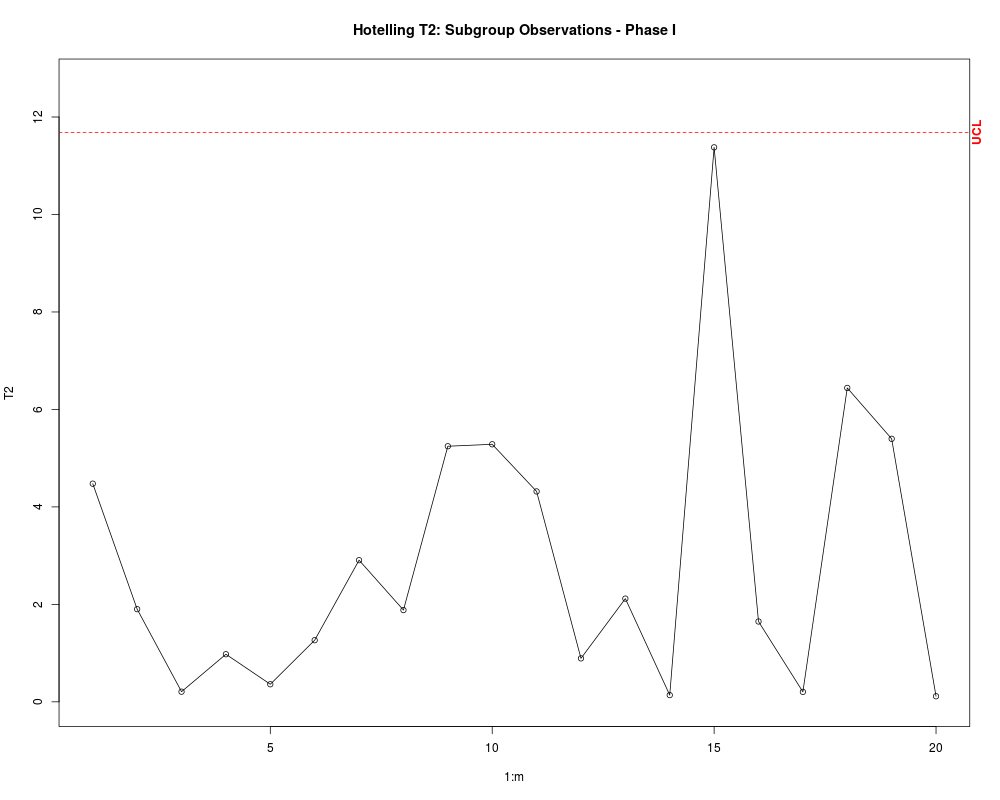
Phase I Hotelling Control Chart.DescriptionBuilds the phase I Hotelling control chart. Usagecchart.T2.1(T2, m, n, p) Arguments
DetailsIt builds the Hotelling T2 control chart for multivariate normal data (m samples / samples of size n > 1), used retrospective / validation analysis (phase I); the control limits are based on the F distribution. ValueReturn a control chart. Author(s)Daniela R. Recchia, Emanuel P. Barbosa ReferencesMontgomery, D.C.,(2008)."Introduction to Statistical Quality Control". Chapter 11. Wiley See Alsocchart.T2.2 Examplesmu <- c(5.682, 88.22) Sigma <- symMatrix(c(3.770, -5.495, 13.53), 2) datum <- data.1(20, 10, mu, Sigma) estat <- stats(datum, 20, 10, 2) T2 <- T2.1(estat, 20, 10) # estat is a list with the auxiliary statistics. T2 is a matrix with the values of the T2 statistic. cchart.T2.1(T2, 20, 10, 2) Results
R version 3.3.1 (2016-06-21) -- "Bug in Your Hair"
Copyright (C) 2016 The R Foundation for Statistical Computing
Platform: x86_64-pc-linux-gnu (64-bit)

R is free software and comes with ABSOLUTELY NO WARRANTY.
You are welcome to redistribute it under certain conditions.
Type 'license()' or 'licence()' for distribution details.

R is a collaborative project with many contributors.
Type 'contributors()' for more information and
'citation()' on how to cite R or R packages in publications.

Type 'demo()' for some demos, 'help()' for on-line help, or
'help.start()' for an HTML browser interface to help.
Type 'q()' to quit R.

> library(IQCC)
Loading required package: qcc
Package 'qcc', version 2.6
Type 'citation("qcc")' for citing this R package in publications.
Loading required package: MASS
Loading required package: micEcon

If you have questions, suggestions, or comments regarding one of the 'micEcon' packages, please use a forum or 'tracker' at micEcon's R-Forge site:
https://r-forge.r-project.org/projects/micecon/
Loading required package: miscTools
> png(filename="/home/ddbj/snapshot/RGM3/R_CC/result/IQCC/cchart.T2.1.Rd_%03d_medium.png", width=480, height=480)
> ### Name: cchart.T2.1
> ### Title: Phase I Hotelling Control Chart.
> ### Aliases: cchart.T2.1
>
> ### ** Examples
>
> mu <- c(5.682, 88.22)
> Sigma <- symMatrix(c(3.770, -5.495, 13.53), 2)
> datum <- data.1(20, 10, mu, Sigma)
> estat <- stats(datum, 20, 10, 2)
> T2 <- T2.1(estat, 20, 10)
> # estat is a list with the auxiliary statistics. T2 is a matrix with the values of the T2 statistic.
> cchart.T2.1(T2, 20, 10, 2)
>
>
>
>
>
> dev.off()
null device
          1
>
|
Created & Maintained by Osamu Ogasawara (osamu.ogasawara@gmail.com) and 