Supported by Dr. Osamu Ogasawara and  . . |
|
Last data update: 2014.03.03 |
Phase II Hotelling Control Chart.DescriptionBuilds the sub group phase II Hotelling control chart. Usagecchart.T2.2(T2II, m, n, j, t, p, datum = NULL, stats = NULL, T2 = NULL) Arguments
For showing the phase I data set in the plot, one of the arguments below must be used (only one of them is necessary).
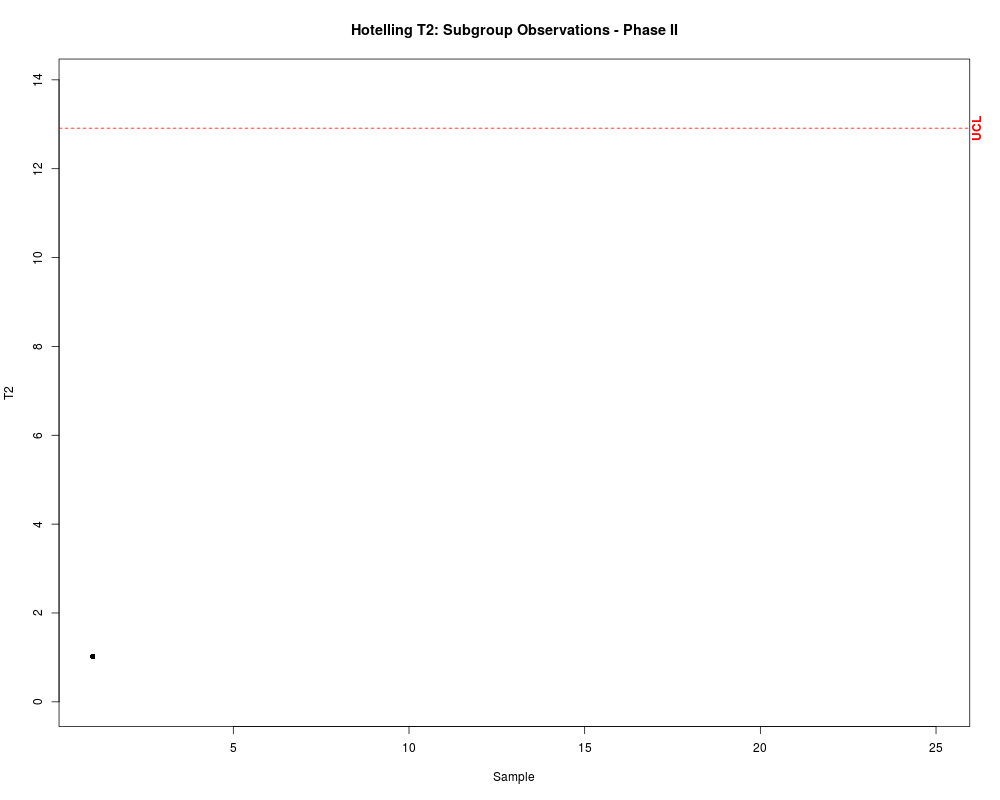
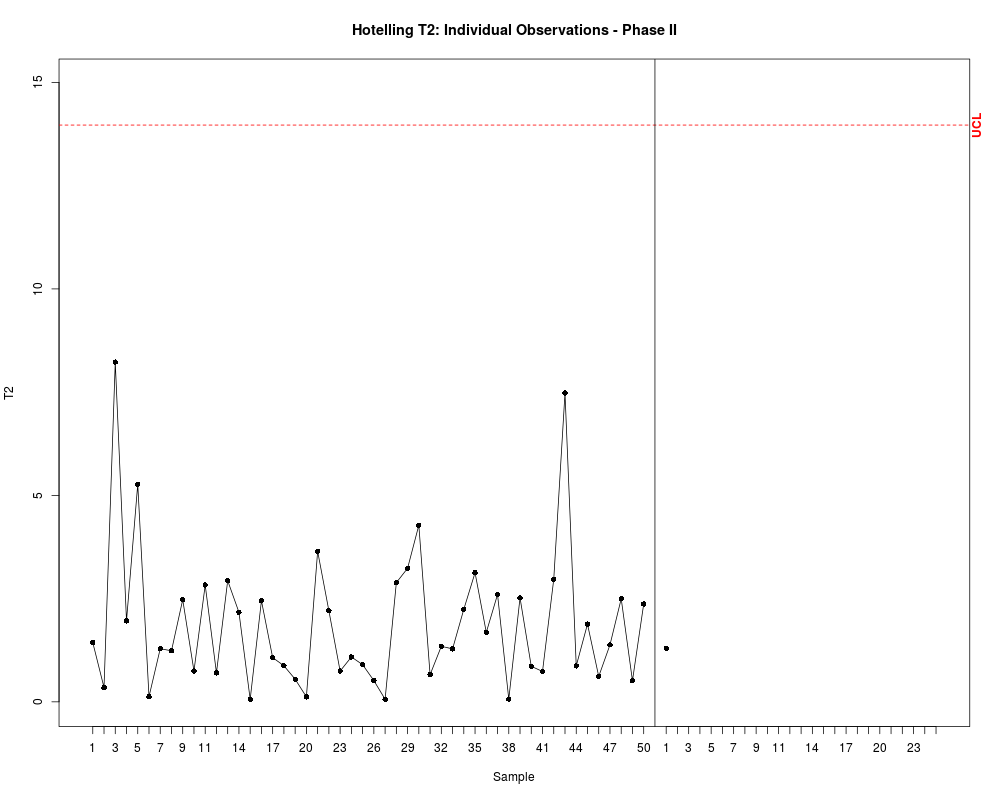
DetailsIt builds the Hotelling T2 control chart for multivariate normal data to be used in the operational phase (known as phase II); the control limits are based on the F distribution. ValueReturn a control chart. Author(s)Daniela R. Recchia, Emanuel P. Barbosa ReferencesMontgomery, D.C.,(2008). "Introduction to Statistical Quality Control". Chapter 11. Wiley See Alsocchart.T2.1 Examplesmu <- c(5.682, 88.22) Sigma <- symMatrix(c(3.770, -5.495, 13.53), 2) datum <- data.1(20, 10, mu, Sigma) estat <- stats(datum, 20, 10, 2) datum2 <- data.2(estat, 10, p = 2) T2II <- T2.2(datum2, estat, 10) # For the first sample j = 1. T2II is a vector with the value of the firts T2 statistic. cchart.T2.2(T2II, 20, 10, 1, 25, 2) # Same of the above, but now showing the phase I data set. cchart.T2.2(T2II, 20, 10, 1, 25, 2, datum = datum) #Example with individual observations datum <- data.1(50, 1, mu, Sigma) estat <- stats(datum, 50, 1, 2) datum2 <- data.2(estat, 1, p = 2) T2II <- T2.2(datum2, estat, 1) # For the first sample j = 1. T2II is a vector with the value of the firts T2 statistic. cchart.T2.2(T2II, 50, 1, 1, 25, 2) # Same of the above, but now showing the phase I data set. cchart.T2.2(T2II, 50, 1, 1, 25, 2, datum = datum) Results
R version 3.3.1 (2016-06-21) -- "Bug in Your Hair"
Copyright (C) 2016 The R Foundation for Statistical Computing
Platform: x86_64-pc-linux-gnu (64-bit)

R is free software and comes with ABSOLUTELY NO WARRANTY.
You are welcome to redistribute it under certain conditions.
Type 'license()' or 'licence()' for distribution details.

R is a collaborative project with many contributors.
Type 'contributors()' for more information and
'citation()' on how to cite R or R packages in publications.

Type 'demo()' for some demos, 'help()' for on-line help, or
'help.start()' for an HTML browser interface to help.
Type 'q()' to quit R.

> library(IQCC)
Loading required package: qcc
Package 'qcc', version 2.6
Type 'citation("qcc")' for citing this R package in publications.
Loading required package: MASS
Loading required package: micEcon

If you have questions, suggestions, or comments regarding one of the 'micEcon' packages, please use a forum or 'tracker' at micEcon's R-Forge site:
https://r-forge.r-project.org/projects/micecon/
Loading required package: miscTools
> png(filename="/home/ddbj/snapshot/RGM3/R_CC/result/IQCC/cchart.T2.2.Rd_%03d_medium.png", width=480, height=480)
> ### Name: cchart.T2.2
> ### Title: Phase II Hotelling Control Chart.
> ### Aliases: cchart.T2.2
>
> ### ** Examples
>
> mu <- c(5.682, 88.22)
> Sigma <- symMatrix(c(3.770, -5.495, 13.53), 2)
> datum <- data.1(20, 10, mu, Sigma)
> estat <- stats(datum, 20, 10, 2)
> datum2 <- data.2(estat, 10, p = 2)
> T2II <- T2.2(datum2, estat, 10)
> # For the first sample j = 1. T2II is a vector with the value of the firts T2 statistic.
> cchart.T2.2(T2II, 20, 10, 1, 25, 2)
> # Same of the above, but now showing the phase I data set.
> cchart.T2.2(T2II, 20, 10, 1, 25, 2, datum = datum)
>
> #Example with individual observations
> datum <- data.1(50, 1, mu, Sigma)
> estat <- stats(datum, 50, 1, 2)
> datum2 <- data.2(estat, 1, p = 2)
> T2II <- T2.2(datum2, estat, 1)
> # For the first sample j = 1. T2II is a vector with the value of the firts T2 statistic.
> cchart.T2.2(T2II, 50, 1, 1, 25, 2)
> # Same of the above, but now showing the phase I data set.
> cchart.T2.2(T2II, 50, 1, 1, 25, 2, datum = datum)
>
>
>
>
>
>
> dev.off()
null device
          1
>
|