Supported by Dr. Osamu Ogasawara and  . . |
|
Last data update: 2014.03.03 |
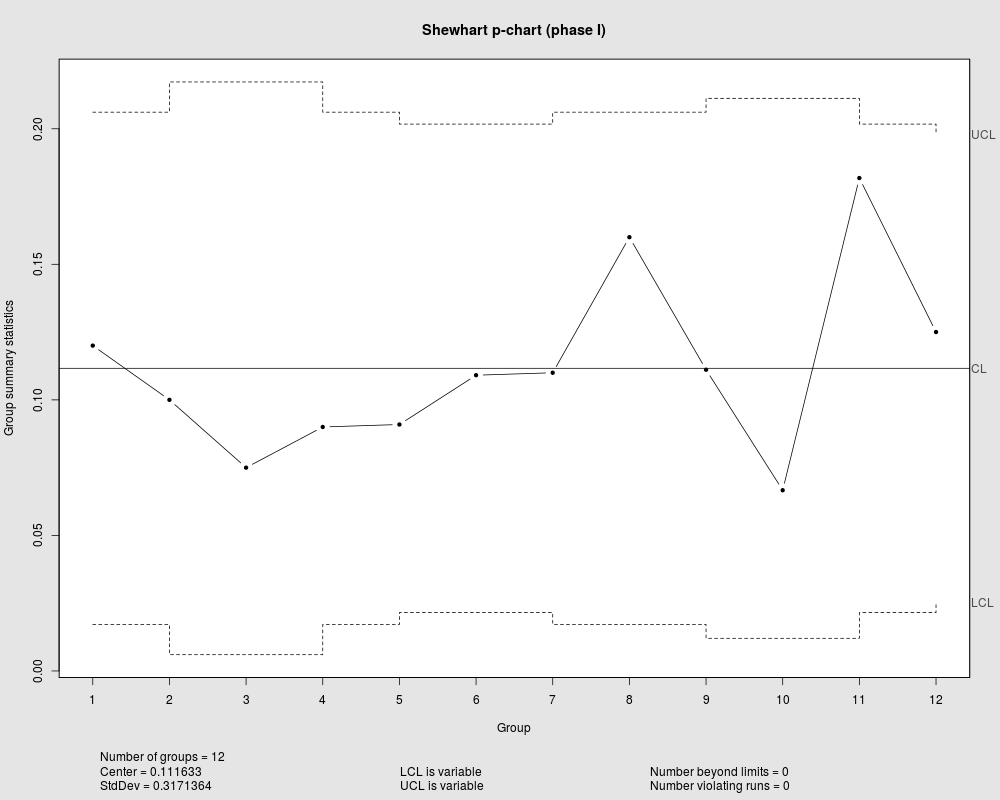
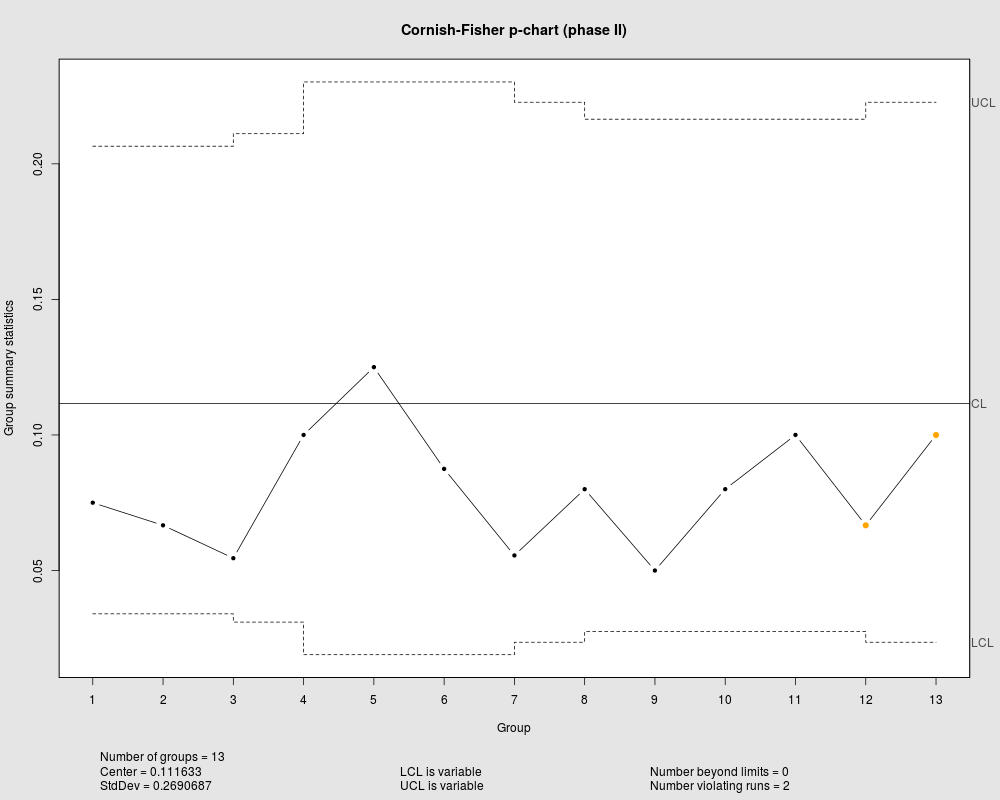
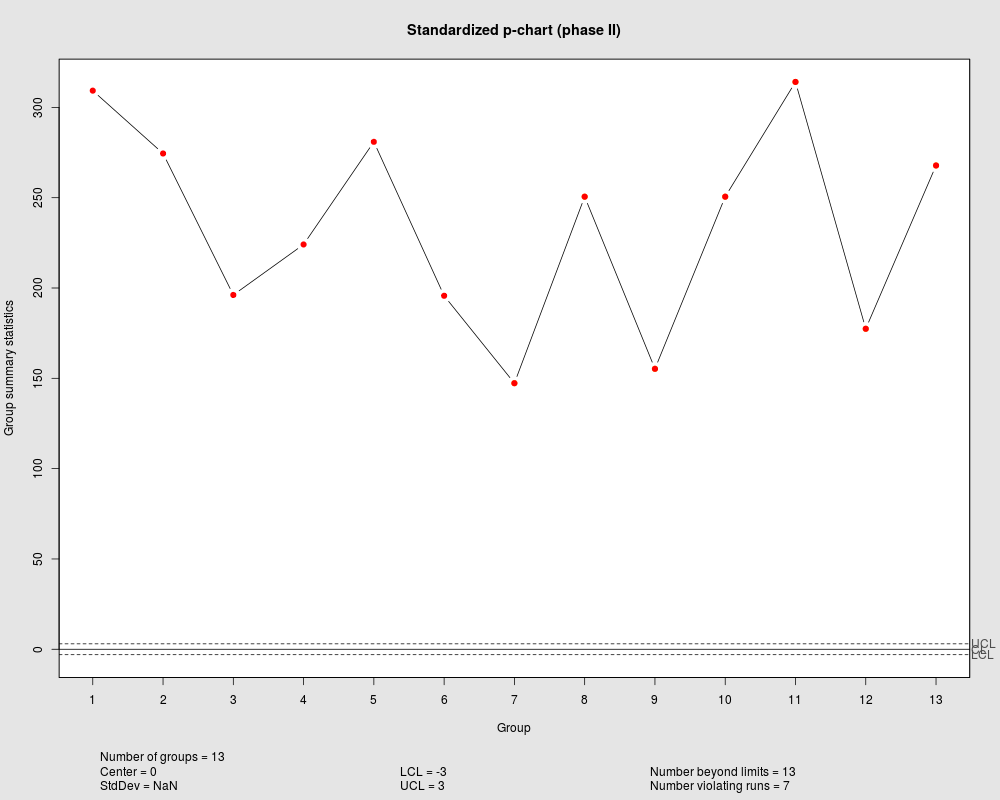
p-chartDescriptionThis function builds p-charts. Usagecchart.p(x1 = NULL, n1 = NULL, type = "norm", p1 = NULL, x2 = NULL, n2 = NULL, phat = NULL, p2 = NULL) Arguments
DetailsFor a phase I p-chart, n1 must be specified and either x1 or p1. For a phase II p-chart, n2 must be specified, plus x2 or p2 and either phat, x1 and n1, or p1 and n1. The Shewhart is based on normal-aprroximation and should be used only for large values of np or n*p (n*p > 6). ValueReturn a p-chart. Author(s)Daniela R. Recchia, Emanuel P. Barbosa ReferencesMontgomery, D.C.,(2008)."Introduction to Statistical Quality Control". Chapter 11. Wiley Examplesdata(binomdata) attach(binomdata) cchart.p(x1 = Di[1:12], n1 = ni[1:12]) cchart.p(x1 = Di[1:12], n1 = ni[1:12], type = "CF", x2 = Di[13:25], n2 = ni[13:25]) cchart.p(type = "std", p2 = Di[13:25], n2 = ni[13:25], phat = 0.1115833) Results
R version 3.3.1 (2016-06-21) -- "Bug in Your Hair"
Copyright (C) 2016 The R Foundation for Statistical Computing
Platform: x86_64-pc-linux-gnu (64-bit)

R is free software and comes with ABSOLUTELY NO WARRANTY.
You are welcome to redistribute it under certain conditions.
Type 'license()' or 'licence()' for distribution details.

R is a collaborative project with many contributors.
Type 'contributors()' for more information and
'citation()' on how to cite R or R packages in publications.

Type 'demo()' for some demos, 'help()' for on-line help, or
'help.start()' for an HTML browser interface to help.
Type 'q()' to quit R.

> library(IQCC)
Loading required package: qcc
Package 'qcc', version 2.6
Type 'citation("qcc")' for citing this R package in publications.
Loading required package: MASS
Loading required package: micEcon

If you have questions, suggestions, or comments regarding one of the 'micEcon' packages, please use a forum or 'tracker' at micEcon's R-Forge site:
https://r-forge.r-project.org/projects/micecon/
Loading required package: miscTools
> png(filename="/home/ddbj/snapshot/RGM3/R_CC/result/IQCC/cchart.p.Rd_%03d_medium.png", width=480, height=480)
> ### Name: cchart.p
> ### Title: p-chart
> ### Aliases: cchart.p
>
> ### ** Examples
>
> data(binomdata)
> attach(binomdata)
The following object is masked from package:base:

    pi

> cchart.p(x1 = Di[1:12], n1 = ni[1:12])
Warning message:
In qcc(x1, type = "p", n1, limits = c(l, u), center = phat, title = "Shewhart p-chart (phase I)") :
  'std.dev' is not used when limits is given
> cchart.p(x1 = Di[1:12], n1 = ni[1:12], type = "CF", x2 = Di[13:25], n2 = ni[13:25])
Warning message:
In qcc(x2, type = "p", n2, limits = c(l, u), center = phat, title = "Cornish-Fisher p-chart (phase II)") :
  'std.dev' is not used when limits is given
> cchart.p(type = "std", p2 = Di[13:25], n2 = ni[13:25], phat = 0.1115833)
List of 11
 $ call      : language qcc(data = std, type = "p", sizes = n2, center = 0, limits = c(-3, 3),      title = "Standardized p-chart (phase II)")
 $ type      : chr "p"
 $ data.name : chr "std"
 $ data      : num [1:13, 1] 37110 32935 21576 17927 22473 ...
  ..- attr(*, "dimnames")=List of 2
 $ statistics: Named num [1:13] 309 274 196 224 281 ...
  ..- attr(*, "names")= chr [1:13] "1" "2" "3" "4" ...
 $ sizes     : int [1:13] 120 120 110 80 80 80 90 100 100 100 ...
 $ center    : num 0
 $ std.dev   : num NaN
 $ nsigmas   : num 3
 $ limits    : num [1, 1:2] -3 3
  ..- attr(*, "dimnames")=List of 2
 $ violations:List of 2
 - attr(*, "class")= chr "qcc"
Warning messages:
1: In sqrt(pbar * (1 - pbar)) : NaNs produced
2: In qcc(std, type = "p", n2, center = 0, limits = c(-3, 3), title = "Standardized p-chart (phase II)") :
  'std.dev' is not used when limits is given
>
>
>
>
>
> dev.off()
null device
          1
>
|