Supported by Dr. Osamu Ogasawara and  . . |
|
Last data update: 2014.03.03 |
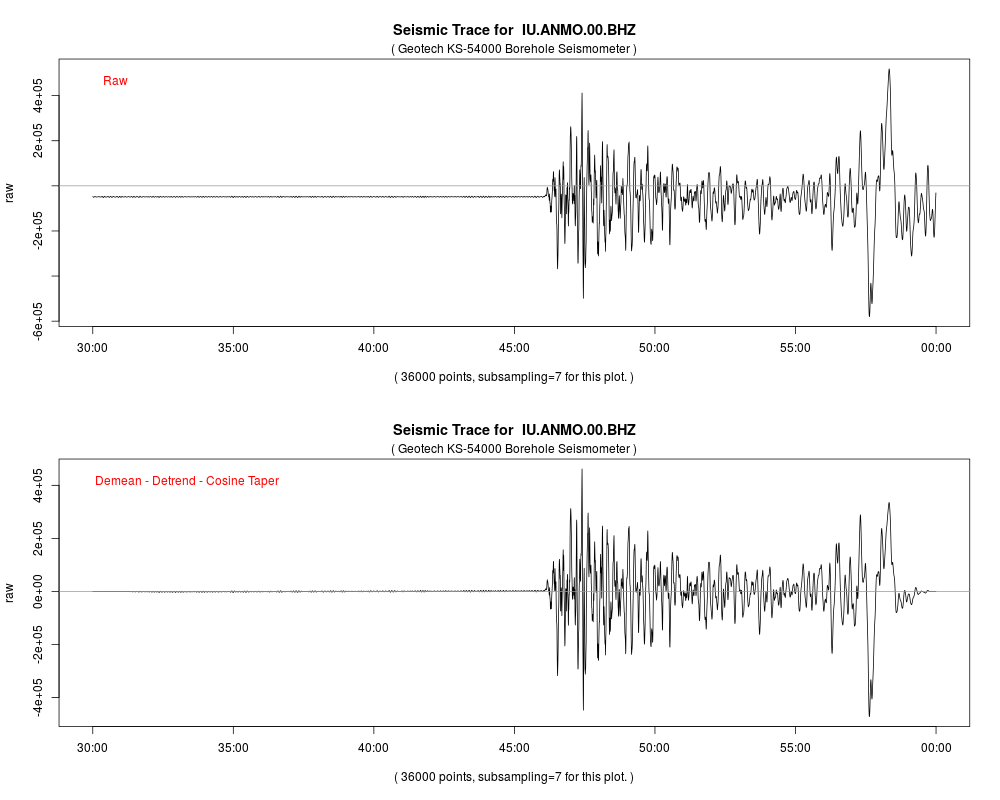
Apply demean, detrend, cosine taperDescriptionThe UsageDDT(x, demean, detrend, taper) Arguments
DetailsUse ValueA new Author(s)Jonathan Callahan jonathan.s.callahan@gmail.com Examples
# Open a connection to IRIS DMC webservices
iris <- new("IrisClient")

# P-wave onset for a big quake
starttime <- as.POSIXct("2010-02-27 06:30:00", tz="GMT")
endtime <- as.POSIXct("2010-02-27 07:00:00", tz="GMT")
st <- getDataselect(iris,"IU","ANMO","00","BHZ",starttime,endtime)

tr <- st@traces[[1]]
trClean <- DDT(tr,TRUE,TRUE,0.1)
layout(matrix(seq(2)))
plot(tr)
abline(h=0,col='gray60')
mtext("Raw",side=3,line=-2,adj=0.05,col='red')
plot(trClean)
abline(h=0,col='gray60')
mtext("Demean - Detrend - Cosine Taper",line=-2,side=3,adj=0.05,col='red')

# Restore default layout
layout(1)
Results
R version 3.3.1 (2016-06-21) -- "Bug in Your Hair"
Copyright (C) 2016 The R Foundation for Statistical Computing
Platform: x86_64-pc-linux-gnu (64-bit)

R is free software and comes with ABSOLUTELY NO WARRANTY.
You are welcome to redistribute it under certain conditions.
Type 'license()' or 'licence()' for distribution details.

R is a collaborative project with many contributors.
Type 'contributors()' for more information and
'citation()' on how to cite R or R packages in publications.

Type 'demo()' for some demos, 'help()' for on-line help, or
'help.start()' for an HTML browser interface to help.
Type 'q()' to quit R.

> library(IRISSeismic)
> png(filename="/home/ddbj/snapshot/RGM3/R_CC/result/IRISSeismic/DDT.Rd_%03d_medium.png", width=480, height=480)
> ### Name: DDT
> ### Title: Apply demean, detrend, cosine taper
> ### Aliases: DDT DDT,Trace,logical,logical,numeric-method
> ###   DDT,Trace,missing,missing,missing-method
> ### Keywords: methods
>
> ### ** Examples
>
> # Open a connection to IRIS DMC webservices
> iris <- new("IrisClient")
>
> # P-wave onset for a big quake
> starttime <- as.POSIXct("2010-02-27 06:30:00", tz="GMT")
> endtime <- as.POSIXct("2010-02-27 07:00:00", tz="GMT")
> st <- getDataselect(iris,"IU","ANMO","00","BHZ",starttime,endtime)
>
> tr <- st@traces[[1]]
> trClean <- DDT(tr,TRUE,TRUE,0.1)
> layout(matrix(seq(2)))
> plot(tr)
> abline(h=0,col='gray60')
> mtext("Raw",side=3,line=-2,adj=0.05,col='red')
> plot(trClean)
> abline(h=0,col='gray60')
> mtext("Demean - Detrend - Cosine Taper",line=-2,side=3,adj=0.05,col='red')
>
> # Restore default layout
> layout(1)
>
>
>
>
>
> dev.off()
null device
          1
>
|
Created & Maintained by Osamu Ogasawara (osamu.ogasawara@gmail.com) and 