Supported by Dr. Osamu Ogasawara and  . . |
|
Last data update: 2014.03.03 |
Classical Item Analysis for Polytomous ItemsDescriptionClassical Item Analysis for Polytomous Items UsageITEMAN2(data, options, ngroup = ncol(data) + 1, correction = TRUE) Arguments
Detailsto be added later Value
Author(s)Cengiz Zopluoglu See Also
Examples
data(timss2011_usa)
timss2011_usa$Q14B <- recode(var = timss2011_usa$Q14B,
recodes = "c(0)=3;c(1)=2;c(2)=1;c(3)=0")
timss2011_usa$Q14C <- recode(var = timss2011_usa$Q14C,
recodes = "c(0)=3;c(1)=2;c(2)=1;c(3)=0")
item.analysis <- ITEMAN2(data=timss2011_usa,
options=c(0,1,2,3),
ngroup=18,
correction=FALSE)
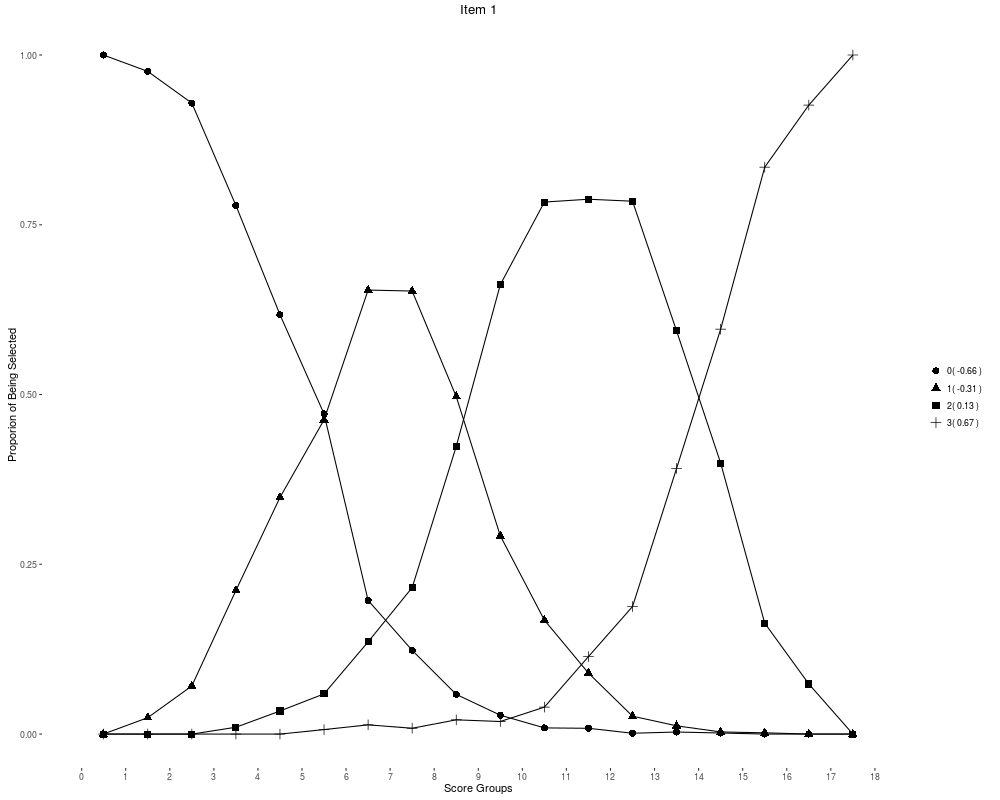
item.analysis$plots[[1]] # Item Trace Line for the first item
# item.analysis$plots[[2]] # Item Trace Line for the second item
# item.analysis$plots[[3]] # Item Trace Line for the third item
# item.analysis$plots[[4]] # Item Trace Line for the fourth item
# item.analysis$plots[[5]] # Item Trace Line for the fifth item
# item.analysis$plots[[6]] # Item Trace Line for the sixth item
Results
R version 3.3.1 (2016-06-21) -- "Bug in Your Hair"
Copyright (C) 2016 The R Foundation for Statistical Computing
Platform: x86_64-pc-linux-gnu (64-bit)

R is free software and comes with ABSOLUTELY NO WARRANTY.
You are welcome to redistribute it under certain conditions.
Type 'license()' or 'licence()' for distribution details.

R is a collaborative project with many contributors.
Type 'contributors()' for more information and
'citation()' on how to cite R or R packages in publications.

Type 'demo()' for some demos, 'help()' for on-line help, or
'help.start()' for an HTML browser interface to help.
Type 'q()' to quit R.

> library(ITEMAN)
Loading required package: ggplot2
Loading required package: polycor
Loading required package: mvtnorm
Loading required package: sfsmisc
Loading required package: car
> png(filename="/home/ddbj/snapshot/RGM3/R_CC/result/ITEMAN/ITEMAN2.Rd_%03d_medium.png", width=480, height=480)
> ### Name: ITEMAN2
> ### Title: Classical Item Analysis for Polytomous Items
> ### Aliases: ITEMAN2
>
> ### ** Examples
>
>
>
> data(timss2011_usa)
>
> timss2011_usa$Q14B <- recode(var = timss2011_usa$Q14B,
+                              recodes = "c(0)=3;c(1)=2;c(2)=1;c(3)=0")
>
> timss2011_usa$Q14C <- recode(var = timss2011_usa$Q14C,
+                              recodes = "c(0)=3;c(1)=2;c(2)=1;c(3)=0")
>
> item.analysis <- ITEMAN2(data=timss2011_usa,
+                          options=c(0,1,2,3),
+                          ngroup=18,
+                          correction=FALSE)
************************************************************************
ITEMAN: An R routine for Classical Item Analysis

Cengiz Zopluoglu

University of Miami
Department of Educational and Psychological Studies
Research, Measurement, and Evaluation Program

c.zopluoglu@miami.edu

Please report any programming bug or problem you experience to improve the code.
*************************************************************************
Processing Date:  Mon Jul  4 19:15:18 2016
                                   ITEM STATISTICS

       Mean Score Item Difficulty Point-Biserial Polyserial
Item 1      1.763           0.588          0.881      0.953
Item 2      1.599           0.533          0.779      0.838
Item 3      1.379           0.460          0.803      0.862
Item 4      1.864           0.621          0.774      0.837
Item 5      1.702           0.567          0.887      0.959
Item 6      2.709           0.903          0.463      0.642

    * Item difficulty is the ratio of mean score to possible maximum score
      and assumes the minimum score is 0


           RESPONSE CATEGORY SELECTION PROPORTIONS

           0     1     2     3
Item 1 0.161 0.189 0.375 0.274
Item 2 0.200 0.263 0.275 0.262
Item 3 0.240 0.330 0.242 0.188
Item 4 0.114 0.206 0.384 0.297
Item 5 0.189 0.191 0.351 0.270
Item 6 0.021 0.026 0.176 0.777


      RESPONSE CATEGORY Point-Biserial Correlation

            0      1      2     3
Item 1 -0.656 -0.308  0.128 0.672
Item 2 -0.627 -0.191  0.180 0.579
Item 3 -0.688 -0.077  0.269 0.550
Item 4 -0.543 -0.332  0.073 0.593
Item 5 -0.682 -0.272  0.154 0.677
Item 6 -0.272 -0.188 -0.289 0.430


            RESPONSE CATEGORY Biserial Correlation

            0      1      2     3
Item 1 -0.987 -0.446  0.164 0.900
Item 2 -0.896 -0.258  0.241 0.782
Item 3 -0.946 -0.101  0.368 0.797
Item 4 -0.895 -0.471  0.093 0.783
Item 5 -0.988 -0.393  0.198 0.909
Item 6 -0.770 -0.499 -0.425 0.600


>
> item.analysis$plots[[1]]   # Item Trace Line for the first item
>
> # item.analysis$plots[[2]]   # Item Trace Line for the second item
> # item.analysis$plots[[3]]   # Item Trace Line for the third item
> # item.analysis$plots[[4]]   # Item Trace Line for the fourth item
> # item.analysis$plots[[5]]   # Item Trace Line for the fifth item
> # item.analysis$plots[[6]]   # Item Trace Line for the sixth item
>
>
>
>
>
>
> dev.off()
null device
          1
>
|
Created & Maintained by Osamu Ogasawara (osamu.ogasawara@gmail.com) and 