character vector of primary IDs, or either vector or list of match pairs.
outcomePairs
The pairs <sample ID, outcome> or NULL (default). In the first case the scatterplot
points are plotted with symbol corresponding to the first letter of the outcome keyword.
In the second, if there are more than one pair is plotted the point set for each pair is marked as 1, 2, etc.
and if there is only one pair is present the unfilled circles are used
xlab
The X axis label. Default is 'protein count'.
ylab
The Y axis label. Default is 'mRNA expression'.
method
the method used to compute the correlation coefficient between X and Y data. Default is "spearman".
proteinNames
extra comments in the plot main title. Default is NULL (no extra comments).
cols
the (recycled) vector of colors to plot each data series with for the particular match pair.
Default is RColorBrewer::brewer.pal(9,"Set1").
cex
Plot font size. Default is 1.
cex.main
Main title font size. Default is 1.2.
cex.lab
X and Y titles font size. Default is 1.
cex.axis
X and Y axis labels font size. Default is 1.
font
data points and axis labels font. Default is 2.
font.main
main title font type. Default is 3.
par.zoom
graphics parameters zoom factor. Scales the graphical parameters
like cex, lwd, mai etc. Default is 1.
...
Additional graphical parameters
Author(s)
Alex Lisovich, Roger Day
See Also
For more information see CorrData.
Examples
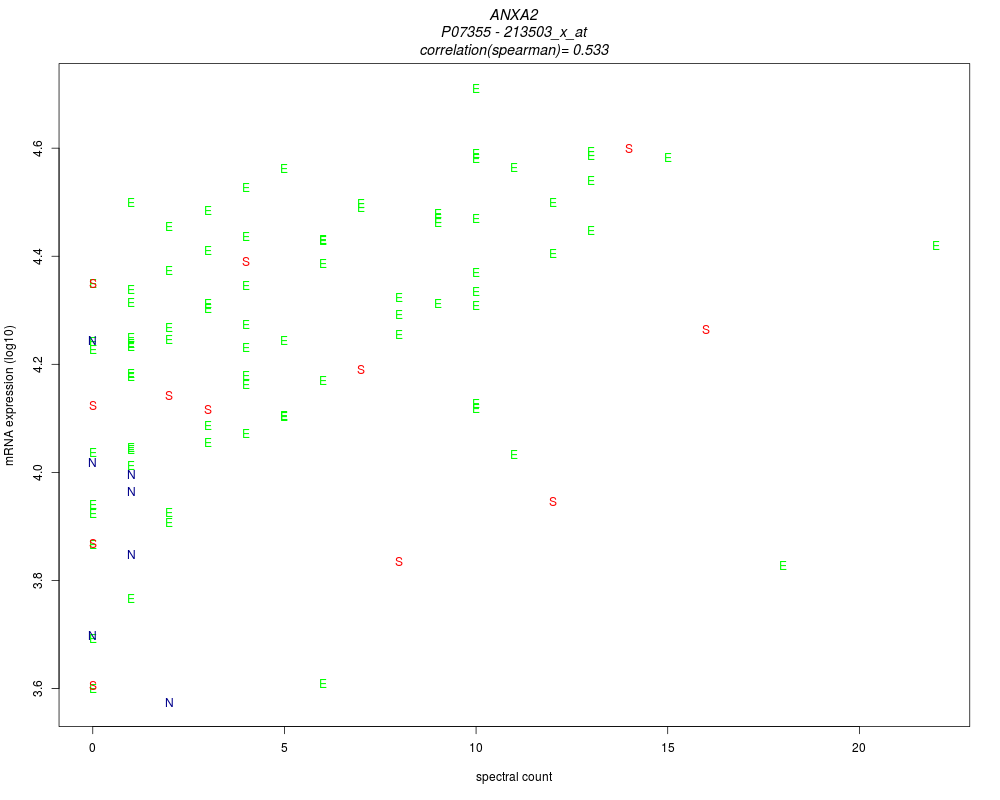
 #scatterplot with outcome for Uniprot="P07355" (annexin 2), probe set ID="213503_x_at"
 examples$corrData$plot(input=list(c("P07355", "213503_x_at")),
	xlab="spectral count",
	outcomePairs=examples$outcomeMap, proteinNames="ANXA2",
	cols=c("green", "red", "darkblue"));
Results
R version 3.3.1 (2016-06-21) -- "Bug in Your Hair"
Copyright (C) 2016 The R Foundation for Statistical Computing
Platform: x86_64-pc-linux-gnu (64-bit)

R is free software and comes with ABSOLUTELY NO WARRANTY.
You are welcome to redistribute it under certain conditions.
Type 'license()' or 'licence()' for distribution details.

R is a collaborative project with many contributors.
Type 'contributors()' for more information and
'citation()' on how to cite R or R packages in publications.

Type 'demo()' for some demos, 'help()' for on-line help, or
'help.start()' for an HTML browser interface to help.
Type 'q()' to quit R.

> library(IdMappingAnalysis)
Loading required package: R.oo
Loading required package: R.methodsS3
R.methodsS3 v1.7.1 (2016-02-15) successfully loaded. See ?R.methodsS3 for help.
R.oo v1.20.0 (2016-02-17) successfully loaded. See ?R.oo for help.

Attaching package: 'R.oo'

The following objects are masked from 'package:methods':

    getClasses, getMethods

The following objects are masked from 'package:base':

    attach, detach, gc, load, save

Loading required package: rChoiceDialogs
Loading required package: rJava

Attaching package: 'rJava'

The following object is masked from 'package:R.oo':

    clone

This is rChoiceDialogs 1.0.6 2014-09-05
This is IdMappingAnalysis 1.16.0 2013-05-24
> png(filename="/home/ddbj/snapshot/RGM3/R_BC/result/IdMappingAnalysis/plot.CorrData.Rd_%03d_medium.png", width=480, height=480)
> ### Name: plot.CorrData
> ### Title: Scatterplot of experiment data
> ### Aliases: plot.CorrData CorrData.plot plot,CorrData-method
> ### Keywords: internal methods
>
> ### ** Examples
>
>  #scatterplot with outcome for Uniprot="P07355" (annexin 2), probe set ID="213503_x_at"
>  examples$corrData$plot(input=list(c("P07355", "213503_x_at")),
+ 	xlab="spectral count",
+ 	outcomePairs=examples$outcomeMap, proteinNames="ANXA2",
+ 	cols=c("green", "red", "darkblue"));
>
>
>
>
>
> dev.off()
null device
          1
>
 .
.