R: Produce a fountain plot representing the quantitative...
plot.IdMapDiffCounts
R Documentation
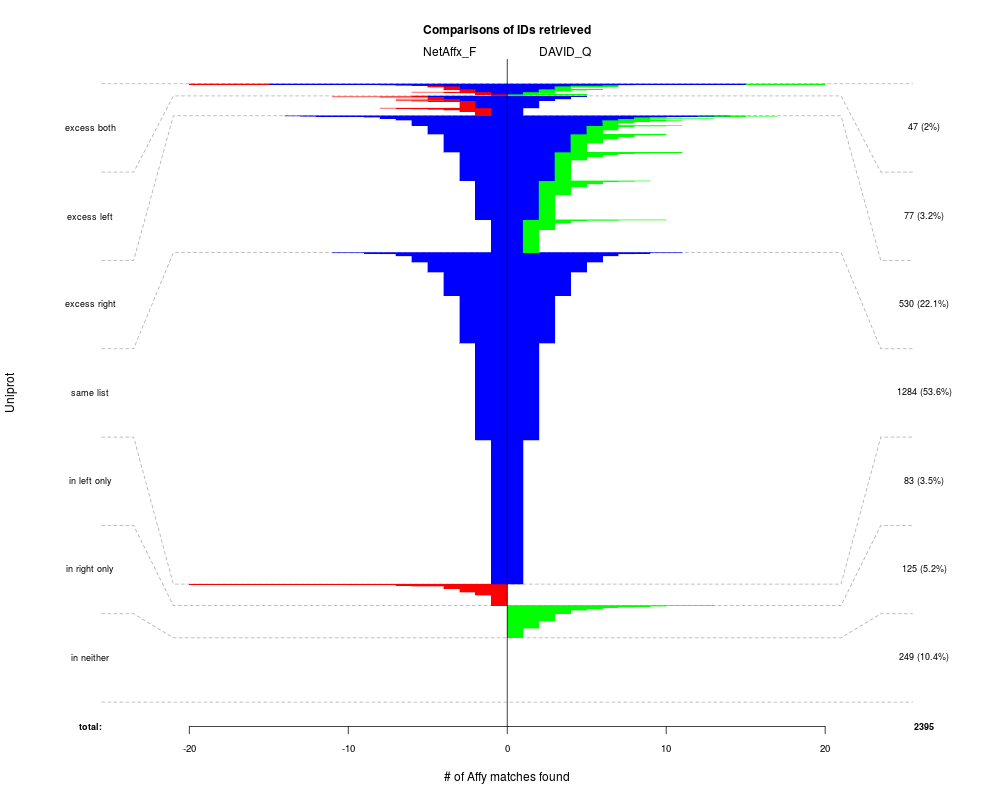
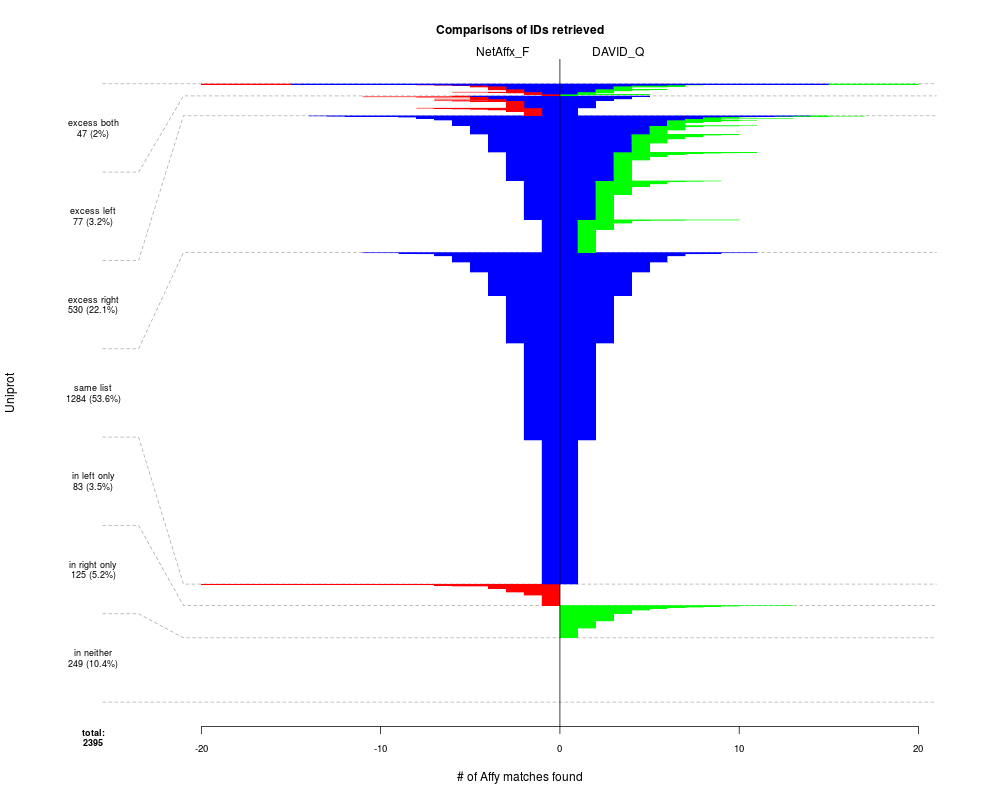
Produce a fountain plot representing the quantitative relationship of the compound events
Description
Produce a fountain plot representing the quantitative relationship of the compound events
<'excess both', 'excess left', 'excess right', 'same list', 'in left only', 'in right only', 'in neither' >
numeric vector of length 3 where the first and second elements
are minimum and maximum count values to be displayed on horizontal axis and the third
element is a distance between horizontal axis tick marks. Default is c(-20,20,10).
reverse
logical indicating the plot orientation (top to bottom or bottom to top)
pairLabels
optional decorated names for ID Map pair in consideration. If NULL (default),
the original ID Map names are used.
guideline.col
guideline(horisontal group divider) lines color. Default is 'darkgrey'.
guideline.lty
guideline lines type. Default is 2 (dashed).
guideline.lwd
guideline lines color. Default is par.zoom.
cols
colors corresponding to the <A-A*B, A*B, B-A*B> events from which the plot is composed.
sides
How compound events labels and counts are placed on plot.
Possible values are 1 or 2. If sides=1 both event labels and counts are placed on one (left) side.
If sides=2 then labels are placed on left side and counts on the right.
cex
plot title font size.
cex.side
compound events side labels font size.
srt
compound events labels orientation.
adj
compound events labels position adjustment (0 - 1), where 0/1 corresponds
to the minimum/maximum labels position shift inwards the plot.
par.zoom
graphics parameters zoom factor. Scales the graphical parameters like cex, lwd, mai etc.
R version 3.3.1 (2016-06-21) -- "Bug in Your Hair"
Copyright (C) 2016 The R Foundation for Statistical Computing
Platform: x86_64-pc-linux-gnu (64-bit)

R is free software and comes with ABSOLUTELY NO WARRANTY.
You are welcome to redistribute it under certain conditions.
Type 'license()' or 'licence()' for distribution details.

R is a collaborative project with many contributors.
Type 'contributors()' for more information and
'citation()' on how to cite R or R packages in publications.

Type 'demo()' for some demos, 'help()' for on-line help, or
'help.start()' for an HTML browser interface to help.
Type 'q()' to quit R.

> library(IdMappingAnalysis)
Loading required package: R.oo
Loading required package: R.methodsS3
R.methodsS3 v1.7.1 (2016-02-15) successfully loaded. See ?R.methodsS3 for help.
R.oo v1.20.0 (2016-02-17) successfully loaded. See ?R.oo for help.

Attaching package: 'R.oo'

The following objects are masked from 'package:methods':

    getClasses, getMethods

The following objects are masked from 'package:base':

    attach, detach, gc, load, save

Loading required package: rChoiceDialogs
Loading required package: rJava

Attaching package: 'rJava'

The following object is masked from 'package:R.oo':

    clone

This is rChoiceDialogs 1.0.6 2014-09-05
This is IdMappingAnalysis 1.16.0 2013-05-24
> png(filename="/home/ddbj/snapshot/RGM3/R_BC/result/IdMappingAnalysis/plot.IdMapDiffCounts.Rd_%03d_medium.png", width=480, height=480)
> ### Name: plot.IdMapDiffCounts
> ### Title: Produce a fountain plot representing the quantitative
> ###   relationship of the compound events
> ### Aliases: plot.IdMapDiffCounts IdMapDiffCounts.plot
> ###   plot,IdMapDiffCounts-method
> ### Keywords: internal methods
>
> ### ** Examples
>
>  #create IdMapDiffCounts object
>  IDs<-IdMapBase$primaryIDs(examples$msmsExperimentSet);
>  jointIdMap<-JointIdMap(examples$identDfList,primaryIDs=IDs);
>  diffs<-jointIdMap$getDiff("NetAffx_F","DAVID_Q",verbose=TRUE);
creating ID Map list from the joint Map object...
creating ID Map: NetAffx_F
creating ID Map: DAVID_Q
creating an IdMapDiff object...
>  diffCounts<-IdMapDiffCounts(diffs);
>
>  # fountain plot of DB pair differences
>  # two-sided labels
>  diffCounts$plot(sides=2);
>  # one-sided labels
>  diffCounts$plot(sides=1);
>
>
>
>
>
> dev.off()
null device
          1
>
 .
.