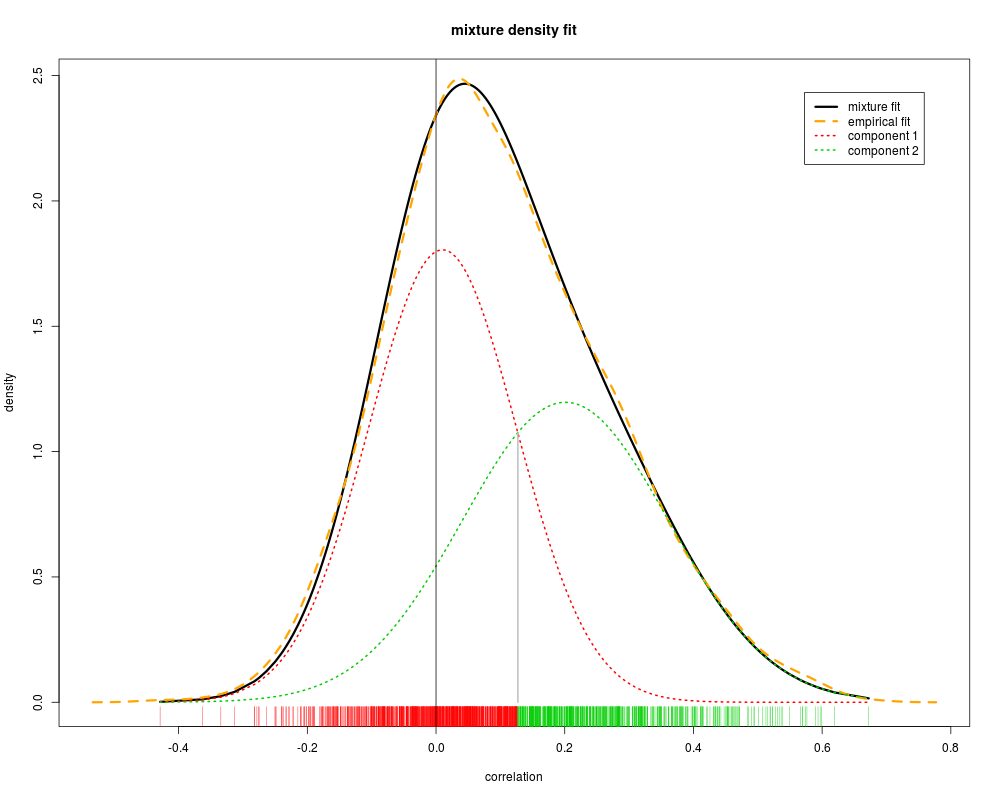
Plot the correlation densities of the
empirical fit, mixture fit and each of the mixture components
Usage
## S3 method for class 'Mixture'
plot(x, title="mixture density fit", cex.main=1.2, cex.lab=1, cex.axis=1, cex.legend=1, lineWidths=c(3, 3, 2), lineTypes=c(1, 2, 3), plot.crossover=TRUE, par.zoom=1, ...)
Arguments
title
main plot title. Default is "nonparametric density fit".
cex.main
Main title font size. Default is 1.2.
cex.lab
X and Y titles font size. Default is 1.
cex.axis
X and Y axis labels font size. Default is 1.
cex.legend
font size for the plot legend. Default is 1.
lineWidths
the vector of length 3 defing the line width for mixture fit,
empirical fit and the micture components curves correspondingly. Default is c(3,3,2).
lineTypes
the vector of length 3 defing the line type for mixture fit,
empirical fit and the micture components curves correspondingly. Default is c(1,2,3).
plot.crossover
If TRUE (default), the vertical lines corresponding to pairwise intersection
of mixture components are plotted.
par.zoom
graphics parameters zoom factor. Scales the graphical parameters
like cex, lwd, mai etc.
...
Additional graphical parameters
Author(s)
Alex Lisovich, Roger Day
See Also
For more information see Mixture.
Examples
examples$mixture$plot();
Results
R version 3.3.1 (2016-06-21) -- "Bug in Your Hair"
Copyright (C) 2016 The R Foundation for Statistical Computing
Platform: x86_64-pc-linux-gnu (64-bit)

R is free software and comes with ABSOLUTELY NO WARRANTY.
You are welcome to redistribute it under certain conditions.
Type 'license()' or 'licence()' for distribution details.

R is a collaborative project with many contributors.
Type 'contributors()' for more information and
'citation()' on how to cite R or R packages in publications.

Type 'demo()' for some demos, 'help()' for on-line help, or
'help.start()' for an HTML browser interface to help.
Type 'q()' to quit R.

> library(IdMappingAnalysis)
Loading required package: R.oo
Loading required package: R.methodsS3
R.methodsS3 v1.7.1 (2016-02-15) successfully loaded. See ?R.methodsS3 for help.
R.oo v1.20.0 (2016-02-17) successfully loaded. See ?R.oo for help.

Attaching package: 'R.oo'

The following objects are masked from 'package:methods':

    getClasses, getMethods

The following objects are masked from 'package:base':

    attach, detach, gc, load, save

Loading required package: rChoiceDialogs
Loading required package: rJava

Attaching package: 'rJava'

The following object is masked from 'package:R.oo':

    clone

This is rChoiceDialogs 1.0.6 2014-09-05
This is IdMappingAnalysis 1.16.0 2013-05-24
> png(filename="/home/ddbj/snapshot/RGM3/R_BC/result/IdMappingAnalysis/plot.Mixture.Rd_%03d_medium.png", width=480, height=480)
> ### Name: plot.Mixture
> ### Title: Plot the results of mixture modeling
> ### Aliases: plot.Mixture Mixture.plot plot,Mixture-method
> ### Keywords: internal methods
>
> ### ** Examples
>
>  examples$mixture$plot();
>
>
>
>
>
> dev.off()
null device
          1
>
 .
.