Supported by Dr. Osamu Ogasawara and  . . |
|
Last data update: 2014.03.03 |
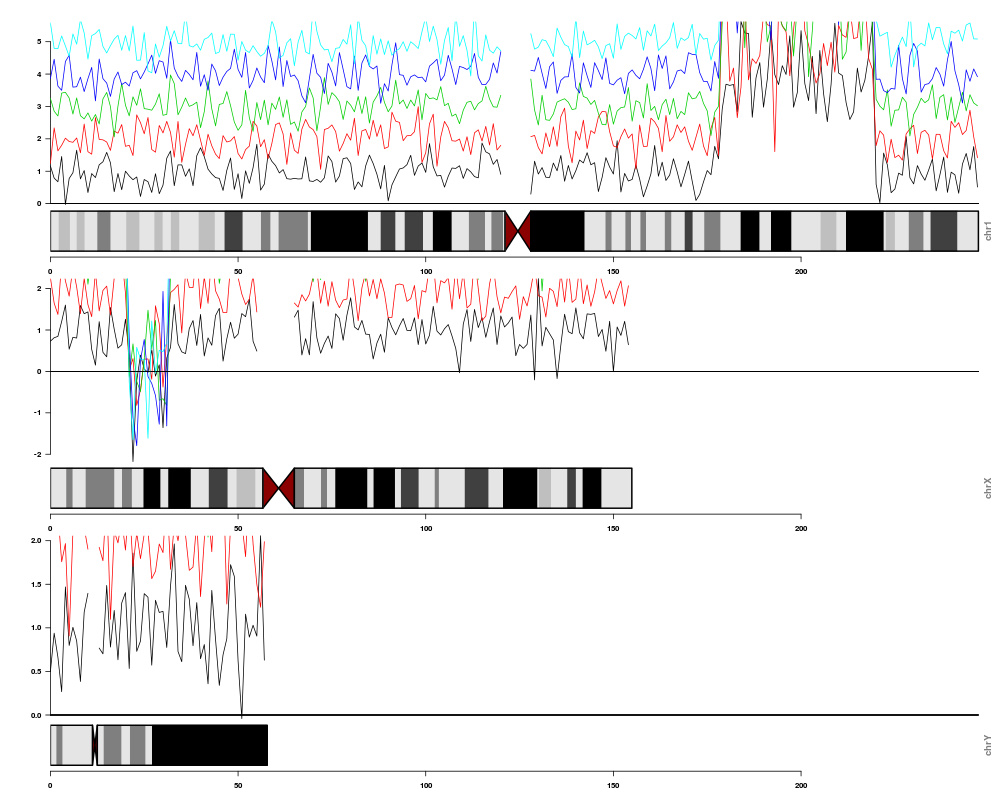
Plot data superimposed on chromosomal ideogramDescriptionMain function to plot binned data alongside chromosomal ideogram. UsageplotOnIdeo(chrom = stop("enter chromosome(s) to plot"), ideoTable,
values_GR, value_cols = "values", plotType = "lines", col = "orange",
bpLim = NULL, val_range = NULL, addScale = TRUE, scaleChrom = TRUE,
vertical = FALSE, addOnetoStart = TRUE, smoothVals = FALSE, cex.axis = 1, plot_title = NULL, ablines_y = NULL, cex.main=1, ...)
Arguments
Details
There are numerous arguments which control the appearance of the plot. The main decision points are:
Other considerations:
Author(s)Shraddha Pai <Shraddha.Pai@camh.ca>, Jingliang Ren Examplesdata(binned_multiSeries) data(hg18_ideo) plotOnIdeo(chrom=seqlevels(binned_multiSeries),ideoTable=hg18_ideo, values_GR=binned_multiSeries, value_cols=colnames(mcols(binned_multiSeries)), col=1:5) Results
R version 3.3.1 (2016-06-21) -- "Bug in Your Hair"
Copyright (C) 2016 The R Foundation for Statistical Computing
Platform: x86_64-pc-linux-gnu (64-bit)

R is free software and comes with ABSOLUTELY NO WARRANTY.
You are welcome to redistribute it under certain conditions.
Type 'license()' or 'licence()' for distribution details.

R is a collaborative project with many contributors.
Type 'contributors()' for more information and
'citation()' on how to cite R or R packages in publications.

Type 'demo()' for some demos, 'help()' for on-line help, or
'help.start()' for an HTML browser interface to help.
Type 'q()' to quit R.

> library(IdeoViz)
Loading required package: Biobase
Loading required package: BiocGenerics
Loading required package: parallel

Attaching package: 'BiocGenerics'

The following objects are masked from 'package:parallel':

    clusterApply, clusterApplyLB, clusterCall, clusterEvalQ,
    clusterExport, clusterMap, parApply, parCapply, parLapply,
    parLapplyLB, parRapply, parSapply, parSapplyLB

The following objects are masked from 'package:stats':

    IQR, mad, xtabs

The following objects are masked from 'package:base':

    Filter, Find, Map, Position, Reduce, anyDuplicated, append,
    as.data.frame, cbind, colnames, do.call, duplicated, eval, evalq,
    get, grep, grepl, intersect, is.unsorted, lapply, lengths, mapply,
    match, mget, order, paste, pmax, pmax.int, pmin, pmin.int, rank,
    rbind, rownames, sapply, setdiff, sort, table, tapply, union,
    unique, unsplit

Welcome to Bioconductor

    Vignettes contain introductory material; view with
    'browseVignettes()'. To cite Bioconductor, see
    'citation("Biobase")', and for packages 'citation("pkgname")'.

Loading required package: IRanges
Loading required package: S4Vectors
Loading required package: stats4

Attaching package: 'S4Vectors'

The following objects are masked from 'package:base':

    colMeans, colSums, expand.grid, rowMeans, rowSums

Loading required package: GenomicRanges
Loading required package: GenomeInfoDb
Loading required package: RColorBrewer
Loading required package: rtracklayer
> png(filename="/home/ddbj/snapshot/RGM3/R_BC/result/IdeoViz/plotOnIdeo.Rd_%03d_medium.png", width=480, height=480)
> ### Name: plotOnIdeo
> ### Title: Plot data superimposed on chromosomal ideogram
> ### Aliases: plotOnIdeo
>
> ### ** Examples
>
> data(binned_multiSeries)
> data(hg18_ideo)
> plotOnIdeo(chrom=seqlevels(binned_multiSeries),ideoTable=hg18_ideo, values_GR=binned_multiSeries, value_cols=colnames(mcols(binned_multiSeries)), col=1:5)
>
>
>
>
>
>
> dev.off()
null device
          1
>
|