Supported by Dr. Osamu Ogasawara and  . . |
|
Last data update: 2014.03.03 |
plot grouped CSMF from a "insilico" objectDescriptionProduce bar plot of the CSMFs for a fitted Usage
stackplot(x, grouping = NULL, type = c("stack", "dodge")[1],
  order.group = NULL, order.sub = NULL, err = TRUE, CI = 0.95,
  sample.size.print = FALSE, xlab = "Group", ylab = "CSMF", ylim = NULL,
  title = "CSMF by broader cause categories", horiz = FALSE, angle = 60,
  err_width = 0.4, err_size = 0.6, point_size = 2, border = "black",
  bw = FALSE, ...)
Arguments
Author(s)Zehang Li, Tyler McCormick, Sam Clark Maintainer: Zehang Li <lizehang@uw.edu> ReferencesTyler H. McCormick, Zehang R. Li, Clara Calvert, Amelia C. Crampin, Kathleen Kahn and Samuel J. Clark Probabilistic cause-of-death assignment using verbal autopsies, arXiv preprint arXiv:1411.3042 http://arxiv.org/abs/1411.3042 (2014) See Also
Examples
data(RandomVA1)
##
## Scenario 1: without sub-population specification
##
fit1<- insilico(RandomVA1, subpop = NULL,
Nsim = 1000, burnin = 500, thin = 10 , seed = 1,
auto.length = FALSE)
# stack bar plot for grouped causes
# the default grouping could be seen from
data(SampleCategory)
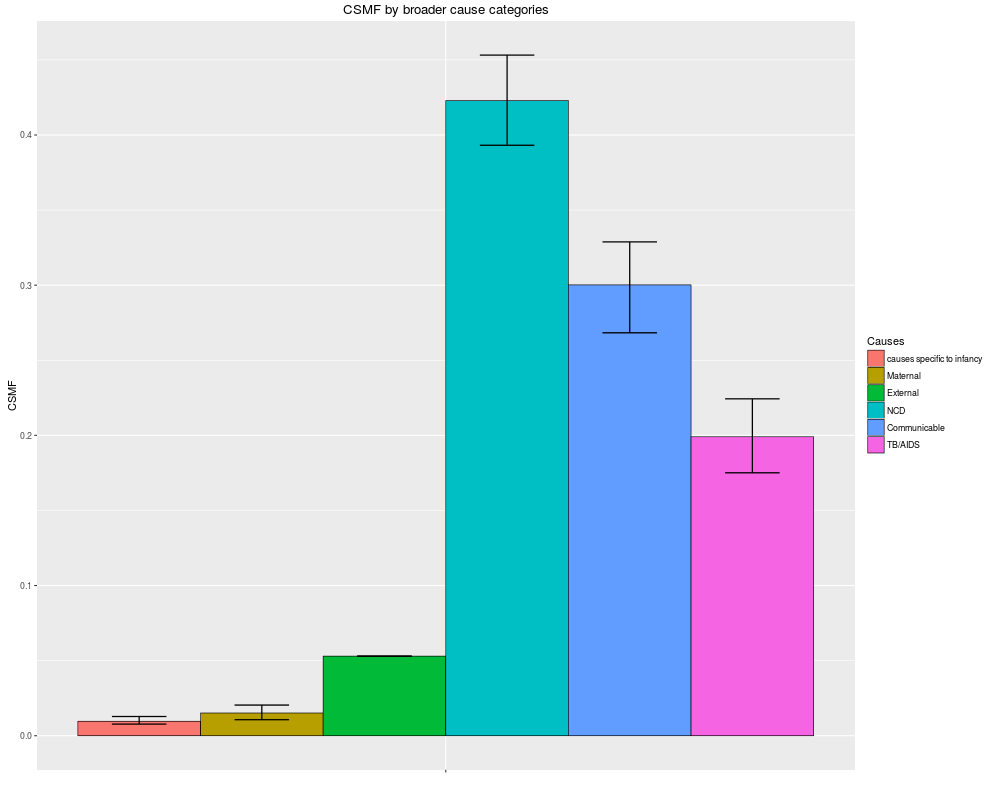
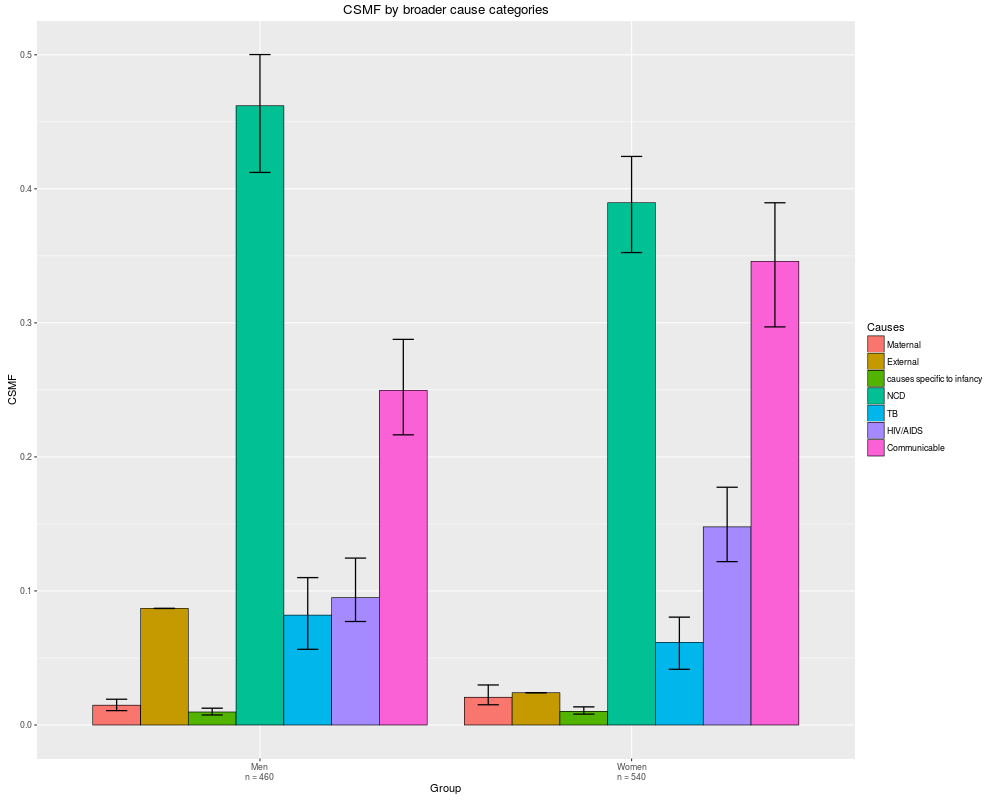
stackplot(fit1, type = "dodge", xlab = "")
##
## Scenario 2: with sub-population specification
##
data(RandomVA2)
fit2<- insilico(RandomVA2, subpop = list("sex"),
Nsim = 1000, burnin = 500, thin = 10 , seed = 1,
auto.length = FALSE)
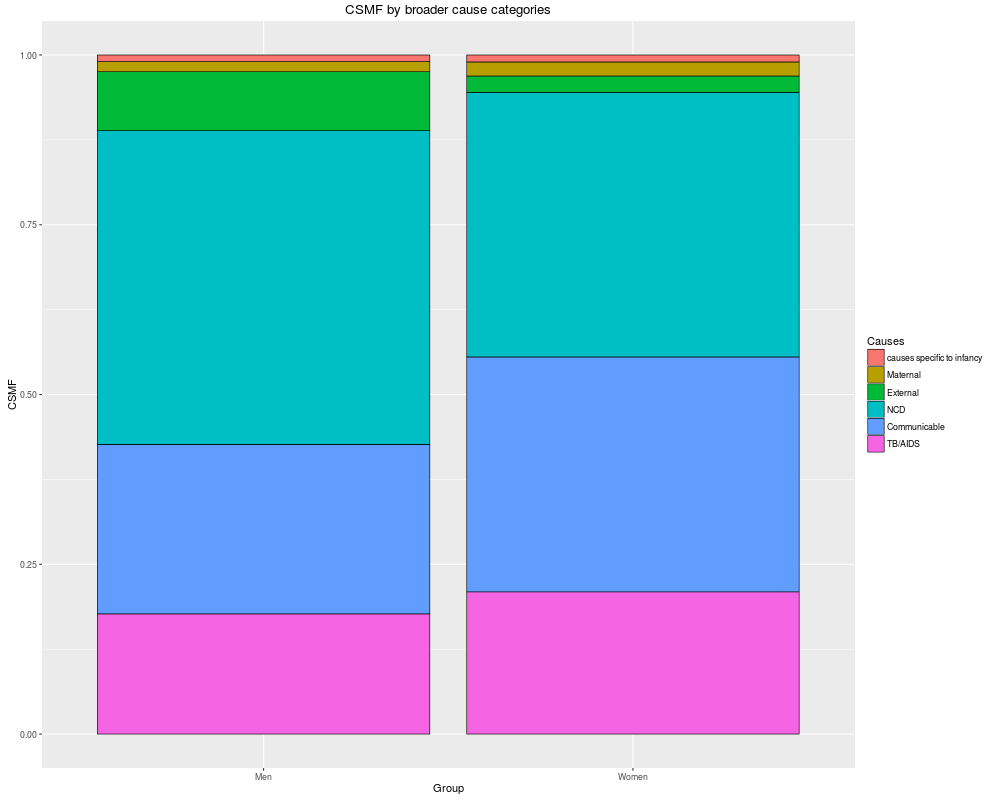
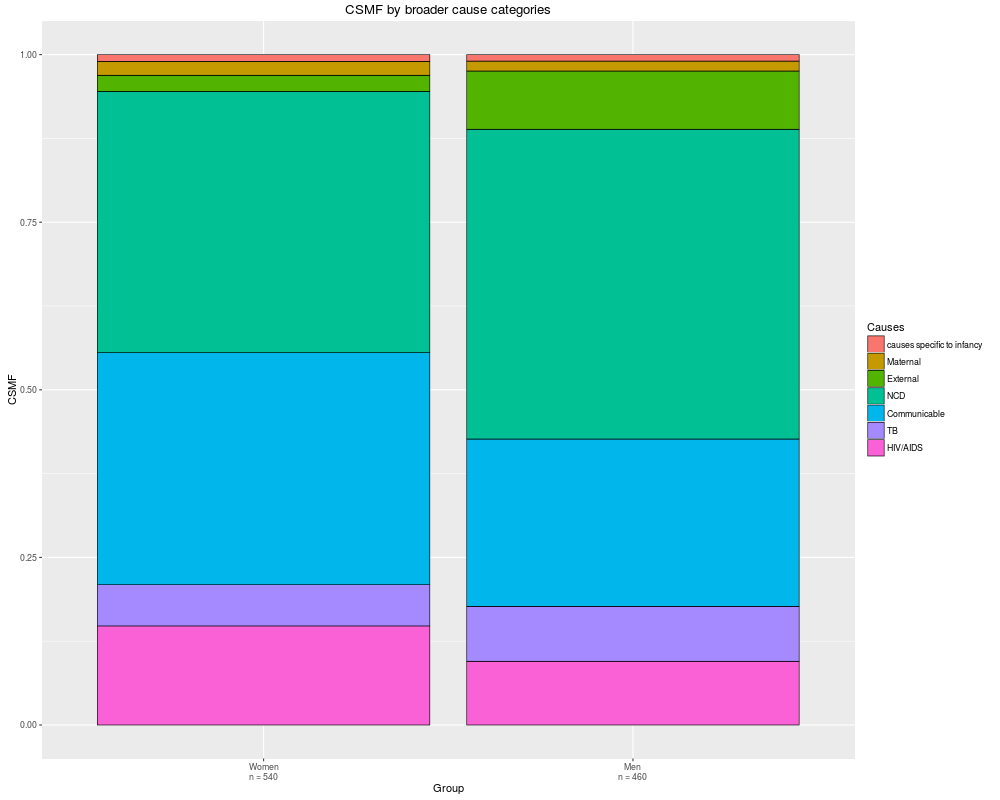
stackplot(fit2, type = "stack", angle = 0)
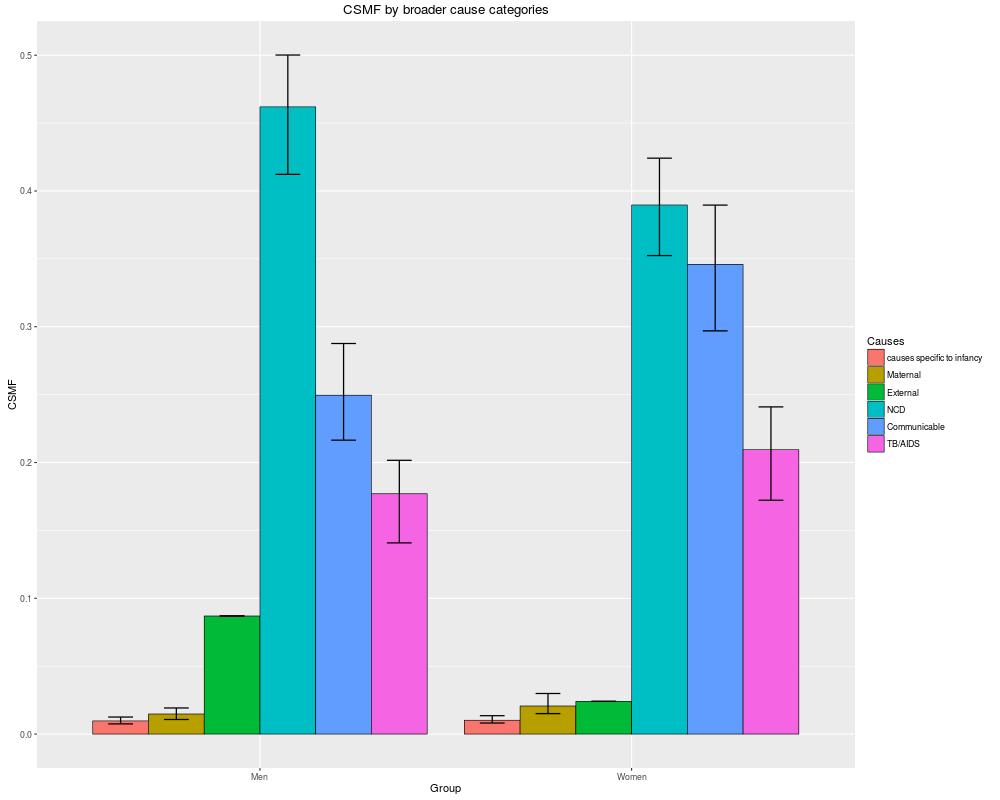
stackplot(fit2, type = "dodge", angle = 0)
# Change the default grouping by separating TB from HIV
data(SampleCategory)
SampleCategory[c(3, 9), ]
SampleCategory[3, 2] <- "HIV/AIDS"
SampleCategory[9, 2] <- "TB"
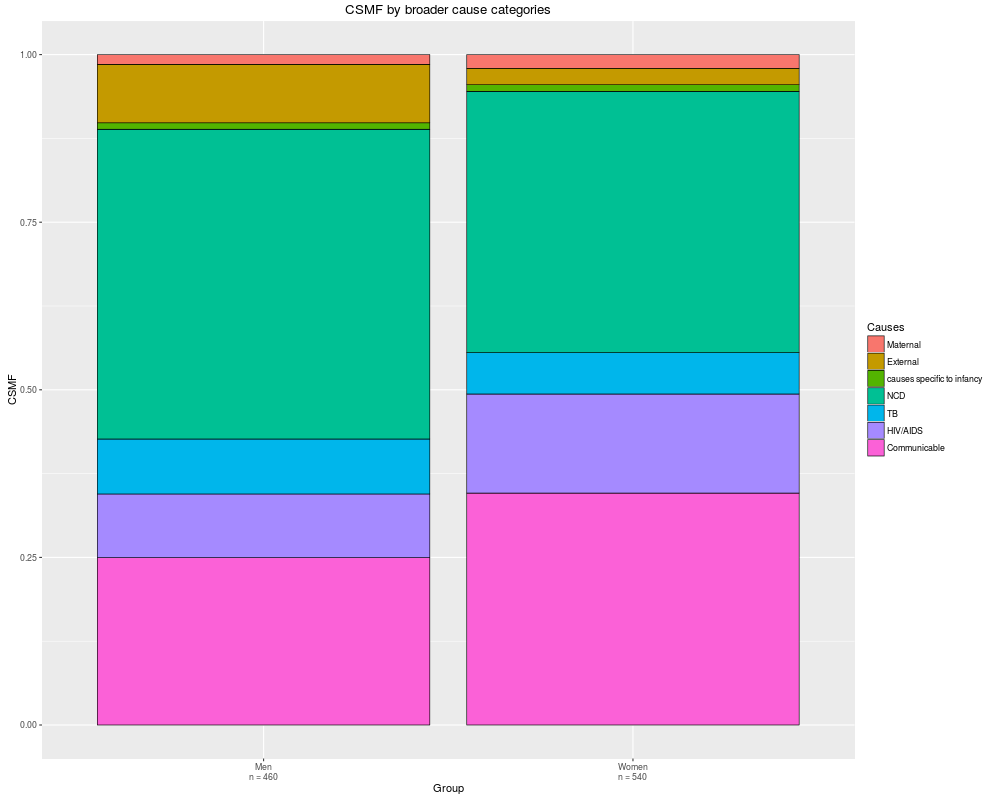
stackplot(fit2, type = "stack", grouping = SampleCategory,
sample.size.print = TRUE, angle = 0)
stackplot(fit2, type = "dodge", grouping = SampleCategory,
sample.size.print = TRUE, angle = 0)
# change the order of display for sub-population and cause groups
groups <- c("HIV/AIDS", "TB", "Communicable", "NCD", "External",
"Maternal", "causes specific to infancy")
subpops <- c("Women", "Men")
stackplot(fit2, type = "stack", grouping = SampleCategory,
order.group = groups, order.sub = subpops,
sample.size.print = TRUE, angle = 0)
Results
R version 3.3.1 (2016-06-21) -- "Bug in Your Hair"
Copyright (C) 2016 The R Foundation for Statistical Computing
Platform: x86_64-pc-linux-gnu (64-bit)

R is free software and comes with ABSOLUTELY NO WARRANTY.
You are welcome to redistribute it under certain conditions.
Type 'license()' or 'licence()' for distribution details.

R is a collaborative project with many contributors.
Type 'contributors()' for more information and
'citation()' on how to cite R or R packages in publications.

Type 'demo()' for some demos, 'help()' for on-line help, or
'help.start()' for an HTML browser interface to help.
Type 'q()' to quit R.

> library(InSilicoVA)
Loading required package: rJava
Loading required package: coda
Loading required package: ggplot2

Please cite the 'InSilicoVA' package as:
Tyler H. McCormick, Zehang R. Li, Clara Calvert, Amelia C. Crampin, Kathleen Kahn and Samuel J. Clark (2014). Probabilistic cause-of-death assignment using verbal autopsies, Journal of the American Statistical Association, to appear

> png(filename="/home/ddbj/snapshot/RGM3/R_CC/result/InSilicoVA/stackplot.Rd_%03d_medium.png", width=480, height=480)
> ### Name: stackplot
> ### Title: plot grouped CSMF from a "insilico" object
> ### Aliases: stackplot
> ### Keywords: InSilicoVA
>
> ### ** Examples
>
> ## No test:
>   data(RandomVA1)
>   ##
>   ## Scenario 1: without sub-population specification
>   ##
>   fit1<- insilico(RandomVA1, subpop = NULL,
+                 Nsim = 1000, burnin = 500, thin = 10 , seed = 1,
+                 auto.length = FALSE)
Performing data consistency check...
Data check finished.
Warning: 58 symptom missing completely and added to missing list
List of missing symptoms:
 died_d1, died_d23, died_d36, died_w1, whoop, chest_in, eye_sunk, born_early, born_3437, born_38, ab_size, born_small, born_big, twin, comdel, cord, waters, move_lb, cyanosis, baby_br, born_nobr, cried, no_life, mushy, fed_d1, st_suck, ab_posit, conv_d1, conv_d2, arch_b, font_hi, font_lo, unw_d1, unw_d2, cold, umbinf, b_yellow, devel, born_malf, mlf_bk, mlf_lh, mlf_sh, mttv, b_norm, b_assist, b_caes, b_first, b_more4, b_mbpr, b_msmds, b_mcon, b_mbvi, b_mvbl, b_bfac, b_bhome, b_bway, b_bprof, vaccin
InSilico Sampler initiated, 1000 iterations to sample
...........
Iteration: 100
Sub-population 0 acceptance ratio: 0.44
0.06min elapsed, 0.55min remaining
..........
Iteration: 200
Sub-population 0 acceptance ratio: 0.38
0.12min elapsed, 0.47min remaining
..........
Iteration: 300
Sub-population 0 acceptance ratio: 0.35
0.18min elapsed, 0.42min remaining
..........
Iteration: 400
Sub-population 0 acceptance ratio: 0.35
0.23min elapsed, 0.34min remaining
..........
Iteration: 500
Sub-population 0 acceptance ratio: 0.32
0.27min elapsed, 0.27min remaining
..........
Iteration: 600
Sub-population 0 acceptance ratio: 0.31
0.33min elapsed, 0.22min remaining
..........
Iteration: 700
Sub-population 0 acceptance ratio: 0.29
0.38min elapsed, 0.16min remaining
..........
Iteration: 800
Sub-population 0 acceptance ratio: 0.28
0.41min elapsed, 0.10min remaining
..........
Iteration: 900
Sub-population 0 acceptance ratio: 0.28
0.46min elapsed, 0.05min remaining
.........
Overall acceptance ratio
Sub-population 0 : 0.2670
Organizing output, might take a moment...
Not all causes with CSMF > 0.02 are convergent.
 Please check using csmf.diag() for more information.
>   # stack bar plot for grouped causes
>   # the default grouping could be seen from
>   data(SampleCategory)
>   stackplot(fit1, type = "dodge", xlab = "")
>
>   ##
>   ## Scenario 2: with sub-population specification
>   ##
>   data(RandomVA2)
>   fit2<- insilico(RandomVA2, subpop = list("sex"),
+                 Nsim = 1000, burnin = 500, thin = 10 , seed = 1,
+                 auto.length = FALSE)
Performing data consistency check...
Data check finished.
Warning: 58 symptom missing completely and added to missing list
List of missing symptoms:
 died_d1, died_d23, died_d36, died_w1, whoop, chest_in, eye_sunk, born_early, born_3437, born_38, ab_size, born_small, born_big, twin, comdel, cord, waters, move_lb, cyanosis, baby_br, born_nobr, cried, no_life, mushy, fed_d1, st_suck, ab_posit, conv_d1, conv_d2, arch_b, font_hi, font_lo, unw_d1, unw_d2, cold, umbinf, b_yellow, devel, born_malf, mlf_bk, mlf_lh, mlf_sh, mttv, b_norm, b_assist, b_caes, b_first, b_more4, b_mbpr, b_msmds, b_mcon, b_mbvi, b_mvbl, b_bfac, b_bhome, b_bway, b_bprof, vaccin
InSilico Sampler initiated, 1000 iterations to sample
...........
Iteration: 100
Sub-population 0 acceptance ratio: 0.41
Sub-population 1 acceptance ratio: 0.45
0.05min elapsed, 0.41min remaining
..........
Iteration: 200
Sub-population 0 acceptance ratio: 0.47
Sub-population 1 acceptance ratio: 0.45
0.10min elapsed, 0.39min remaining
..........
Iteration: 300
Sub-population 0 acceptance ratio: 0.43
Sub-population 1 acceptance ratio: 0.46
0.16min elapsed, 0.37min remaining
..........
Iteration: 400
Sub-population 0 acceptance ratio: 0.42
Sub-population 1 acceptance ratio: 0.41
0.22min elapsed, 0.33min remaining
..........
Iteration: 500
Sub-population 0 acceptance ratio: 0.42
Sub-population 1 acceptance ratio: 0.40
0.27min elapsed, 0.27min remaining
..........
Iteration: 600
Sub-population 0 acceptance ratio: 0.40
Sub-population 1 acceptance ratio: 0.38
0.32min elapsed, 0.21min remaining
..........
Iteration: 700
Sub-population 0 acceptance ratio: 0.38
Sub-population 1 acceptance ratio: 0.36
0.37min elapsed, 0.16min remaining
..........
Iteration: 800
Sub-population 0 acceptance ratio: 0.37
Sub-population 1 acceptance ratio: 0.36
0.43min elapsed, 0.11min remaining
..........
Iteration: 900
Sub-population 0 acceptance ratio: 0.37
Sub-population 1 acceptance ratio: 0.34
0.48min elapsed, 0.05min remaining
.........
Overall acceptance ratio
Sub-population 0 : 0.3730
Sub-population 1 : 0.3350
Organizing output, might take a moment...
Not all causes with CSMF > 0.02 are convergent.
 Please check using csmf.diag() for more information.
>   stackplot(fit2, type = "stack", angle = 0)
>   stackplot(fit2, type = "dodge", angle = 0)
>   # Change the default grouping by separating TB from HIV
>   data(SampleCategory)
>   SampleCategory[c(3, 9), ]
                 InterVA Physician
3 HIV/AIDS related death   TB/AIDS
9 Pulmonary tuberculosis   TB/AIDS
>   SampleCategory[3, 2] <- "HIV/AIDS"
>   SampleCategory[9, 2] <- "TB"
>   stackplot(fit2, type = "stack", grouping = SampleCategory,
+             sample.size.print = TRUE, angle = 0)
>   stackplot(fit2, type = "dodge", grouping = SampleCategory,
+             sample.size.print = TRUE, angle = 0)
>
>   # change the order of display for sub-population and cause groups
>   groups <- c("HIV/AIDS", "TB", "Communicable", "NCD", "External",
+               "Maternal", "causes specific to infancy")
>   subpops <- c("Women", "Men")
>   stackplot(fit2, type = "stack", grouping = SampleCategory,
+             order.group = groups, order.sub = subpops,
+             sample.size.print = TRUE, angle = 0)
> ## End(No test)
>
>
>
>
>
> dev.off()
null device
          1
>
|