A JunctionSeqCountSet. Usually created by runJunctionSeqAnalyses.
Alternatively, this can be created manually by readJunctionSeqCounts.
Dispersions and size factors must then be
set, usually using functions estimateSizeFactors and
estimateJunctionSeqDispersions. Hypothesis tests must
be performed by testForDiffUsage.
ylim
The plotting range for the y-axis.
xlim
The plotting range for the x-axis.
linecol
Character vector of length 2. The line color to use for the fit line. If the fits were performed separately for exons and junctions, the junction line will be drawn with the second color.
pointcol
Character vector of length 2. The point color to use for the final dispersions. If the fits were performed separately for exons and junctions, the junction points will be drawn with the second color.
title.main
The main title of the plot.
xlab
The label for the x-axis.
ylab
The label for the y-axis.
miniTicks
Whether or not to plot smaller ticks at the tenth-decades.
par.cex
The base cex value to be passed to par() immediately before all plots are created. See par.
points.cex
The character expansion value for the plotted points.
text.cex
The character expansion value for the annotation text (labels, etc).
lines.cex
The character expansion value for lines. What this means seems to vary depending on the plotting device.
pch.MLE
Numeric. The pch code for the MLE (ie single-feature) dispersion estimate. The default is a small point.
pch.MAP
Numeric. The pch code for the MAP (ie. final) dispersion estimate. The default is a circle.
lwd.fitted
Numeric. The width of the dispersion fit line(s).
use.smoothScatter
Logical. If TRUE, features will be ploted with density shading rather than having each point plotted.
smooth.nbin
The number of bins to smooth, for the density plot, if use.smoothScatter is TRUE.
nrpoints
The number of extra points to plot, if use.smoothScatter is TRUE.
plot.exon.results
Logical. If TRUE, plot results for exons. Technically speaking, JunctionSeq can be used to do DEXSeq-style analyses on exon partitions. However this functionality is for advanced users only.
plot.junction.results
Logical. If TRUE, plot results for splice junctions. For advanced users only.
anno.lwd
The lwd value to be passed to lines, box, axis, and similar.
mar
The margin sizes, expressed in lines. see link{par}.
show.legends
Logical. If TRUE, display legends.
verbose
if TRUE, send debugging and progress messages to the console / stdout.
debug.mode
if TRUE, send even more debugging and progress messages to the console / stdout.
...
Additional options to pass to plotting functions, particularly graphical parameters.
Value
This is a side-effecting function, and does not return a value.
R version 3.3.1 (2016-06-21) -- "Bug in Your Hair"
Copyright (C) 2016 The R Foundation for Statistical Computing
Platform: x86_64-pc-linux-gnu (64-bit)
R is free software and comes with ABSOLUTELY NO WARRANTY.
You are welcome to redistribute it under certain conditions.
Type 'license()' or 'licence()' for distribution details.
R is a collaborative project with many contributors.
Type 'contributors()' for more information and
'citation()' on how to cite R or R packages in publications.
Type 'demo()' for some demos, 'help()' for on-line help, or
'help.start()' for an HTML browser interface to help.
Type 'q()' to quit R.
> library(JunctionSeq)
Loading required package: SummarizedExperiment
Loading required package: GenomicRanges
Loading required package: BiocGenerics
Loading required package: parallel
Attaching package: 'BiocGenerics'
The following objects are masked from 'package:parallel':
clusterApply, clusterApplyLB, clusterCall, clusterEvalQ,
clusterExport, clusterMap, parApply, parCapply, parLapply,
parLapplyLB, parRapply, parSapply, parSapplyLB
The following objects are masked from 'package:stats':
IQR, mad, xtabs
The following objects are masked from 'package:base':
Filter, Find, Map, Position, Reduce, anyDuplicated, append,
as.data.frame, cbind, colnames, do.call, duplicated, eval, evalq,
get, grep, grepl, intersect, is.unsorted, lapply, lengths, mapply,
match, mget, order, paste, pmax, pmax.int, pmin, pmin.int, rank,
rbind, rownames, sapply, setdiff, sort, table, tapply, union,
unique, unsplit
Loading required package: S4Vectors
Loading required package: stats4
Attaching package: 'S4Vectors'
The following objects are masked from 'package:base':
colMeans, colSums, expand.grid, rowMeans, rowSums
Loading required package: IRanges
Loading required package: GenomeInfoDb
Loading required package: Biobase
Welcome to Bioconductor
Vignettes contain introductory material; view with
'browseVignettes()'. To cite Bioconductor, see
'citation("Biobase")', and for packages 'citation("pkgname")'.
> png(filename="/home/ddbj/snapshot/RGM3/R_BC/result/JunctionSeq/plotDispEsts.Rd_%03d_medium.png", width=480, height=480)
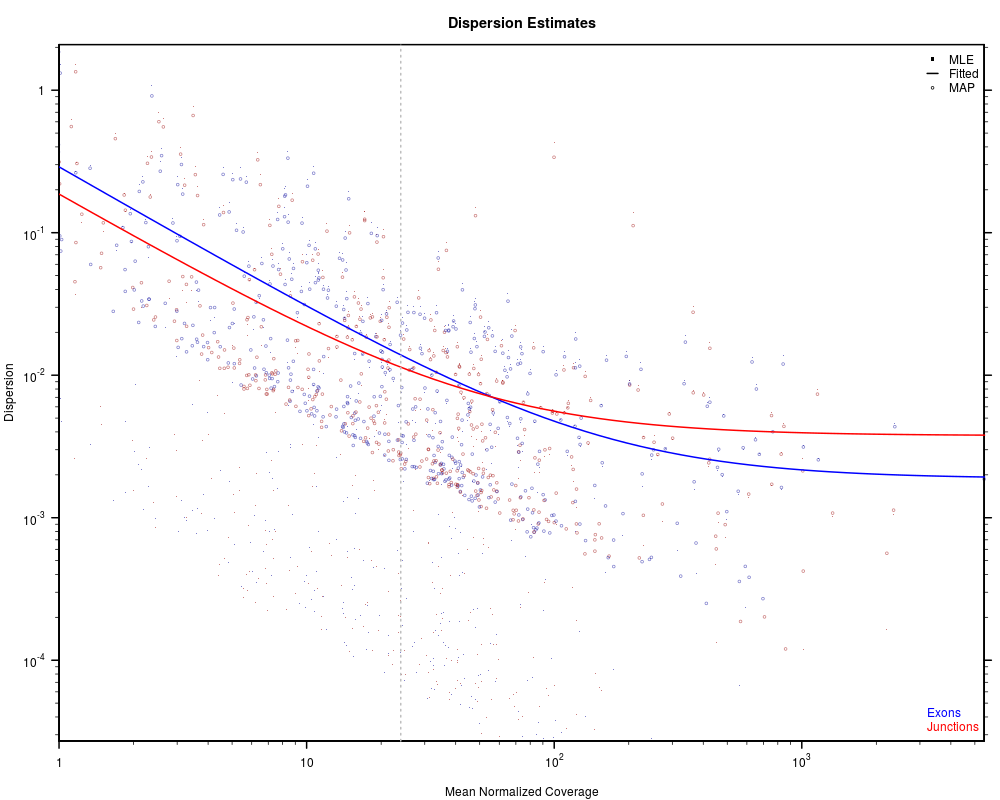
> ### Name: plotDispEsts
> ### Title: Plot Fitted and Test-wise Dispersion
> ### Aliases: plotDispEsts
>
> ### ** Examples
>
> data(exampleDataSet,package="JctSeqData");
> plotDispEsts(jscs);
abundance ranges from 0.146009972023612 to 5452.18841073905
dispersion ranges from 1.94121697570967e-06 to 2.08746163174998
Plotting dispersions from 2.71367228072472e-05 to 2.08746163174998
>
> ## Not run:
> ##D ########################################
> ##D #Set up example data:
> ##D decoder.file <- system.file(
> ##D "extdata/annoFiles/decoder.bySample.txt",
> ##D package="JctSeqData");
> ##D decoder <- read.table(decoder.file,
> ##D header=TRUE,
> ##D stringsAsFactors=FALSE);
> ##D gff.file <- system.file(
> ##D "extdata/cts/withNovel.forJunctionSeq.gff.gz",
> ##D package="JctSeqData");
> ##D countFiles <- system.file(paste0("extdata/cts/",
> ##D decoder$sample.ID,
> ##D "/QC.spliceJunctionAndExonCounts.withNovel.forJunctionSeq.txt.gz"),
> ##D package="JctSeqData");
> ##D ######################
> ##D #Run example analysis:
> ##D jscs <- runJunctionSeqAnalyses(sample.files = countFiles,
> ##D sample.names = decoder$sample.ID,
> ##D condition=factor(decoder$group.ID),
> ##D flat.gff.file = gff.file,
> ##D analysis.type = "junctionsAndExons"
> ##D );
> ##D ########################################
> ##D
> ##D #Plot dispersions:
> ##D plotDispEsts(jscs);
> ##D
> ## End(Not run)
>
>
>
>
>
> dev.off()
null device
1
>
 .
.