Last data update: 2014.03.03

R: Generate a MA-Plot
plotMAR Documentation

Generate a MA-Plot

Description

Generates an MA-plot, which graphs the fold change versus the mean normalized expression. Statistically significant features are colored red.

Usage

plotMA(jscs, 
       FDR.threshold = 0.01, 
       fc.name = NULL,
       fc.thresh = 1,
       use.pch = 20,
       smooth.nbin = 256, 
       ylim = c( 1 / 1000,1000),
       use.smoothScatter = TRUE,
       label.counts = TRUE,
       label.axes = c(TRUE,TRUE,FALSE,FALSE), 
       show.labels = TRUE,
       par.cex = 1, points.cex = 1, text.cex = 1,
       lines.cex = 8,
       anno.lwd = 2, mar = c(4.1,4.1,3.1,1.1),
       miniTicks = TRUE, 
       verbose = TRUE, debug.mode = FALSE,
       ...)

Arguments

jscs

A JunctionSeqCountSet. Usually created by runJunctionSeqAnalyses.

Alternatively, this can be created manually by readJunctionSeqCounts. However in this case a number of additional steps will be necessary: Dispersions and size factors must then be set, usually using functions estimateSizeFactors and estimateJunctionSeqDispersions. Hypothesis tests must be performed by testForDiffUsage. Effect sizes and parameter estimates must be created via estimateEffectSizes.
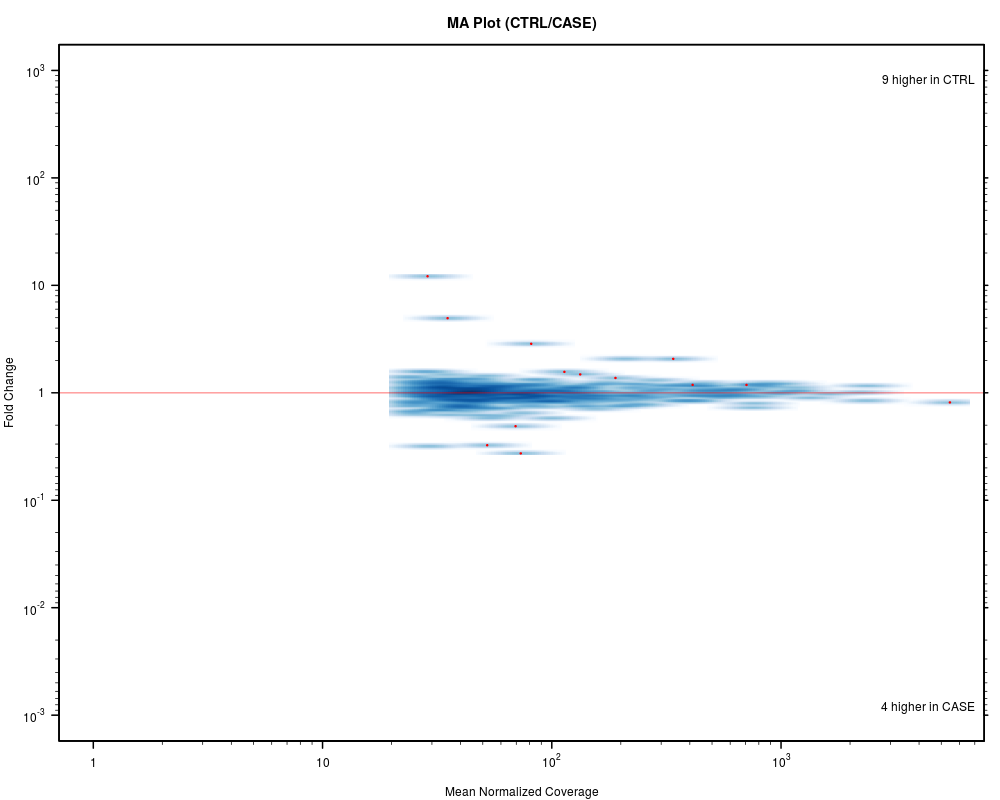
FDR.threshold

The FDR threshold used to color dots. Tests with an adjusted-p-value more significant than this threshold will be marked in red.

fc.name

The name of the column to take from fData(jscs).

fc.thresh

The fold-change threshold required to count a significant locus in the count labels. It will also draw horizontal lines at this threshold.

use.pch

The value of pch to pass to the points call.

use.smoothScatter

Logical. If TRUE, non-significant genes will be ploted with density shading.

smooth.nbin

The number of bins to smooth, for the density plot, if use.smoothScatter is TRUE.

ylim

The y-axis limits.

label.counts

Logical. If TRUE, include labels showing the number of loci that pass both the statistical-significance and fold-change threshold in each direction.

label.axes

Logical vector. Whether to label each axis. Must have length 4; each corresponds to the bottom, left, top, and right axes respectively.

show.labels

Logical. If TRUE, include all titles and axes labels.

par.cex

The cex value to be passed to par.

points.cex

The cex value to be passed to points.

text.cex

The cex value to be passed to text.

lines.cex

The cex value to be passed to lines, box, and similar.

anno.lwd

The lwd value to be passed to lines, box, axis, and similar.

mar

The margin sizes, expressed in lines. see link{par}.

miniTicks

Logical. If TRUE, then include "mini tick marks" on the x and y axes.

verbose

if TRUE, send debugging and progress messages to the console / stdout.

debug.mode

if TRUE, send even more debugging and progress messages to the console / stdout.

...

Additional graphical parameters.

Value

This is a side-effecting function, and does not return a value.

Examples

data(exampleDataSet,package="JctSeqData");
plotMA(jscs);


## Not run: 
########################################
#Set up example data:
decoder.file <- system.file(
                  "extdata/annoFiles/decoder.bySample.txt",
                  package="JctSeqData");
decoder <- read.table(decoder.file,
                  header=TRUE,
                  stringsAsFactors=FALSE);
gff.file <- system.file(
            "extdata/cts/withNovel.forJunctionSeq.gff.gz",
            package="JctSeqData");
countFiles <- system.file(paste0("extdata/cts/",
     decoder$sample.ID,
     "/QC.spliceJunctionAndExonCounts.withNovel.forJunctionSeq.txt.gz"),
     package="JctSeqData");
######################
#Run example analysis:
jscs <- runJunctionSeqAnalyses(sample.files = countFiles,
           sample.names = decoder$sample.ID,
           condition=factor(decoder$group.ID),
           flat.gff.file = gff.file,
           analysis.type = "junctionsAndExons"
);
########################################

#Plot M-A:
plotMA(jscs);


## End(Not run)

Results


R version 3.3.1 (2016-06-21) -- "Bug in Your Hair"
Copyright (C) 2016 The R Foundation for Statistical Computing
Platform: x86_64-pc-linux-gnu (64-bit)

R is free software and comes with ABSOLUTELY NO WARRANTY.
You are welcome to redistribute it under certain conditions.
Type 'license()' or 'licence()' for distribution details.

R is a collaborative project with many contributors.
Type 'contributors()' for more information and
'citation()' on how to cite R or R packages in publications.

Type 'demo()' for some demos, 'help()' for on-line help, or
'help.start()' for an HTML browser interface to help.
Type 'q()' to quit R.

> library(JunctionSeq)
Loading required package: SummarizedExperiment
Loading required package: GenomicRanges
Loading required package: BiocGenerics
Loading required package: parallel

Attaching package: 'BiocGenerics'

The following objects are masked from 'package:parallel':

    clusterApply, clusterApplyLB, clusterCall, clusterEvalQ,
    clusterExport, clusterMap, parApply, parCapply, parLapply,
    parLapplyLB, parRapply, parSapply, parSapplyLB

The following objects are masked from 'package:stats':

    IQR, mad, xtabs

The following objects are masked from 'package:base':

    Filter, Find, Map, Position, Reduce, anyDuplicated, append,
    as.data.frame, cbind, colnames, do.call, duplicated, eval, evalq,
    get, grep, grepl, intersect, is.unsorted, lapply, lengths, mapply,
    match, mget, order, paste, pmax, pmax.int, pmin, pmin.int, rank,
    rbind, rownames, sapply, setdiff, sort, table, tapply, union,
    unique, unsplit

Loading required package: S4Vectors
Loading required package: stats4

Attaching package: 'S4Vectors'

The following objects are masked from 'package:base':

    colMeans, colSums, expand.grid, rowMeans, rowSums

Loading required package: IRanges
Loading required package: GenomeInfoDb
Loading required package: Biobase
Welcome to Bioconductor

    Vignettes contain introductory material; view with
    'browseVignettes()'. To cite Bioconductor, see
    'citation("Biobase")', and for packages 'citation("pkgname")'.

> png(filename="/home/ddbj/snapshot/RGM3/R_BC/result/JunctionSeq/plotMA.Rd_%03d_medium.png", width=480, height=480)
> ### Name: plotMA
> ### Title: Generate a MA-Plot
> ### Aliases: plotMA
> 
> ### ** Examples
> 
> data(exampleDataSet,package="JctSeqData");
> plotMA(jscs);
> 
> 
> ## Not run: 
> ##D ########################################
> ##D #Set up example data:
> ##D decoder.file <- system.file(
> ##D                   "extdata/annoFiles/decoder.bySample.txt",
> ##D                   package="JctSeqData");
> ##D decoder <- read.table(decoder.file,
> ##D                   header=TRUE,
> ##D                   stringsAsFactors=FALSE);
> ##D gff.file <- system.file(
> ##D             "extdata/cts/withNovel.forJunctionSeq.gff.gz",
> ##D             package="JctSeqData");
> ##D countFiles <- system.file(paste0("extdata/cts/",
> ##D      decoder$sample.ID,
> ##D      "/QC.spliceJunctionAndExonCounts.withNovel.forJunctionSeq.txt.gz"),
> ##D      package="JctSeqData");
> ##D ######################
> ##D #Run example analysis:
> ##D jscs <- runJunctionSeqAnalyses(sample.files = countFiles,
> ##D            sample.names = decoder$sample.ID,
> ##D            condition=factor(decoder$group.ID),
> ##D            flat.gff.file = gff.file,
> ##D            analysis.type = "junctionsAndExons"
> ##D );
> ##D ########################################
> ##D 
> ##D #Plot M-A:
> ##D plotMA(jscs);
> ##D 
> ## End(Not run)
> 
> 
> 
> 
> 
> dev.off()
null device 
          1 
>