Supported by Dr. Osamu Ogasawara and  . . |
|
Last data update: 2014.03.03 |
KCsmartDescriptionMultiple sample aCGH analysis using kernel convolution Details
Use the wrapper function 'calcSpm' to calculate the sample point matrix. Use 'findSigLevelTrad' to find a significance threshold using permutation based testing. Use 'plot' to plot the sample point matrix or 'plotScaleSpace' to plot the significant regions over multiple scales (sigmas). Use 'getSigSegments' to retrieve the significantly gained and lost regions using specific cutoffs. To use the comparative version of KCsmart, use the 'calcSpmCollection', 'compareSpmCollection' and 'getSigRegionsCompKC' functions. See the documentation of those function for details on how to use these. Author(s)Jorma de Ronde, Christiaan Klijn Maintainer: Jorma de Ronde <j.d.ronde@nki.nl> ReferencesIdentification of cancer genes using a statistical framework for multiexperiment analysis of nondiscretized array CGH data. Nucleic Acids Res. 2008 Feb;36(2):e13. See Also
Examplesdata(hsSampleData) data(hsMirrorLocs) spm1mb <- calcSpm(hsSampleData, hsMirrorLocs) spm4mb <- calcSpm(hsSampleData, hsMirrorLocs, sigma=4000000) plot(spm1mb) plot(spm1mb, chromosomes=c(1,5,6,'X')) siglevel1mb <- findSigLevelTrad(hsSampleData, spm1mb, n=3) siglevel4mb <- findSigLevelTrad(hsSampleData, spm4mb, n=3) plot(spm1mb, sigLevel=siglevel1mb) plotScaleSpace(list(spm1mb, spm4mb), list(siglevel1mb, siglevel4mb), type='g') sigSegments1mb <- getSigSegments(spm1mb, siglevel1mb) spmc1mb <- calcSpmCollection(hsSampleData, hsMirrorLocs, cl=c(rep(0,10),rep(1,10))) spmcc1mb <- compareSpmCollection(spmc1mb, nperms=3) spmcc1mbSigRegions <- getSigRegionsCompKC(spmcc1mb) plot(spmcc1mb, sigRegions=spmcc1mbSigRegions) Results
R version 3.3.1 (2016-06-21) -- "Bug in Your Hair"
Copyright (C) 2016 The R Foundation for Statistical Computing
Platform: x86_64-pc-linux-gnu (64-bit)
R is free software and comes with ABSOLUTELY NO WARRANTY.
You are welcome to redistribute it under certain conditions.
Type 'license()' or 'licence()' for distribution details.
R is a collaborative project with many contributors.
Type 'contributors()' for more information and
'citation()' on how to cite R or R packages in publications.
Type 'demo()' for some demos, 'help()' for on-line help, or
'help.start()' for an HTML browser interface to help.
Type 'q()' to quit R.
> library(KCsmart)
Loading required package: siggenes
Loading required package: Biobase
Loading required package: BiocGenerics
Loading required package: parallel
Attaching package: 'BiocGenerics'
The following objects are masked from 'package:parallel':
clusterApply, clusterApplyLB, clusterCall, clusterEvalQ,
clusterExport, clusterMap, parApply, parCapply, parLapply,
parLapplyLB, parRapply, parSapply, parSapplyLB
The following objects are masked from 'package:stats':
IQR, mad, xtabs
The following objects are masked from 'package:base':
Filter, Find, Map, Position, Reduce, anyDuplicated, append,
as.data.frame, cbind, colnames, do.call, duplicated, eval, evalq,
get, grep, grepl, intersect, is.unsorted, lapply, lengths, mapply,
match, mget, order, paste, pmax, pmax.int, pmin, pmin.int, rank,
rbind, rownames, sapply, setdiff, sort, table, tapply, union,
unique, unsplit
Welcome to Bioconductor
Vignettes contain introductory material; view with
'browseVignettes()'. To cite Bioconductor, see
'citation("Biobase")', and for packages 'citation("pkgname")'.
Loading required package: multtest
Loading required package: splines
Loading required package: KernSmooth
KernSmooth 2.23 loaded
Copyright M. P. Wand 1997-2009
> png(filename="/home/ddbj/snapshot/RGM3/R_BC/result/KCsmart/KCsmart-package.Rd_%03d_medium.png", width=480, height=480)
> ### Name: KCsmart-package
> ### Title: KCsmart
> ### Aliases: KCsmart-package KCsmart
> ### Keywords: package
>
> ### ** Examples
>
> data(hsSampleData)
> data(hsMirrorLocs)
>
> spm1mb <- calcSpm(hsSampleData, hsMirrorLocs)
[1] "Mirror locations looking fine"
[1] "Splitting data .."
[1] "Summing data .."
[1] "Mirroring data .."
[1] "Calculating sample point matrix .."
Processing chromosome 1
Processing chromosome 10
Processing chromosome 11
Processing chromosome 12
Processing chromosome 13
Processing chromosome 14
Processing chromosome 15
Processing chromosome 16
Processing chromosome 17
Processing chromosome 18
Processing chromosome 19
Processing chromosome 2
Processing chromosome 20
Processing chromosome 21
Processing chromosome 22
Processing chromosome 3
Processing chromosome 4
Processing chromosome 5
Processing chromosome 6
Processing chromosome 7
Processing chromosome 8
Processing chromosome 9
Processing chromosome X
Processing chromosome Y
[1] "Done"
> spm4mb <- calcSpm(hsSampleData, hsMirrorLocs, sigma=4000000)
[1] "Mirror locations looking fine"
[1] "Splitting data .."
[1] "Summing data .."
[1] "Mirroring data .."
[1] "Calculating sample point matrix .."
Processing chromosome 1
Processing chromosome 10
Processing chromosome 11
Processing chromosome 12
Processing chromosome 13
Processing chromosome 14
Processing chromosome 15
Processing chromosome 16
Processing chromosome 17
Processing chromosome 18
Processing chromosome 19
Processing chromosome 2
Processing chromosome 20
Processing chromosome 21
Processing chromosome 22
Processing chromosome 3
Processing chromosome 4
Processing chromosome 5
Processing chromosome 6
Processing chromosome 7
Processing chromosome 8
Processing chromosome 9
Processing chromosome X
Processing chromosome Y
[1] "Done"
>
> plot(spm1mb)
> plot(spm1mb, chromosomes=c(1,5,6,'X'))
>
> siglevel1mb <- findSigLevelTrad(hsSampleData, spm1mb, n=3)
[1] "Calculating alpha = 0.05 significance cut-off"
[1] "Found 584 pos peaks and 598 neg peaks in observed sample point matrix"
[1] "Calculating Mirror Positions"
[1] "Starting permutations .."
At iteration 1 of 3[1] "Permuting"
[1] "Combining"
[1] "Returning"
At iteration 2 of 3[1] "Permuting"
[1] "Combining"
[1] "Returning"
At iteration 3 of 3[1] "Permuting"
[1] "Combining"
[1] "Returning"
> siglevel4mb <- findSigLevelTrad(hsSampleData, spm4mb, n=3)
[1] "Calculating alpha = 0.05 significance cut-off"
[1] "Found 169 pos peaks and 174 neg peaks in observed sample point matrix"
[1] "Calculating Mirror Positions"
[1] "Starting permutations .."
At iteration 1 of 3[1] "Permuting"
[1] "Combining"
[1] "Returning"
At iteration 2 of 3[1] "Permuting"
[1] "Combining"
[1] "Returning"
At iteration 3 of 3[1] "Permuting"
[1] "Combining"
[1] "Returning"
>
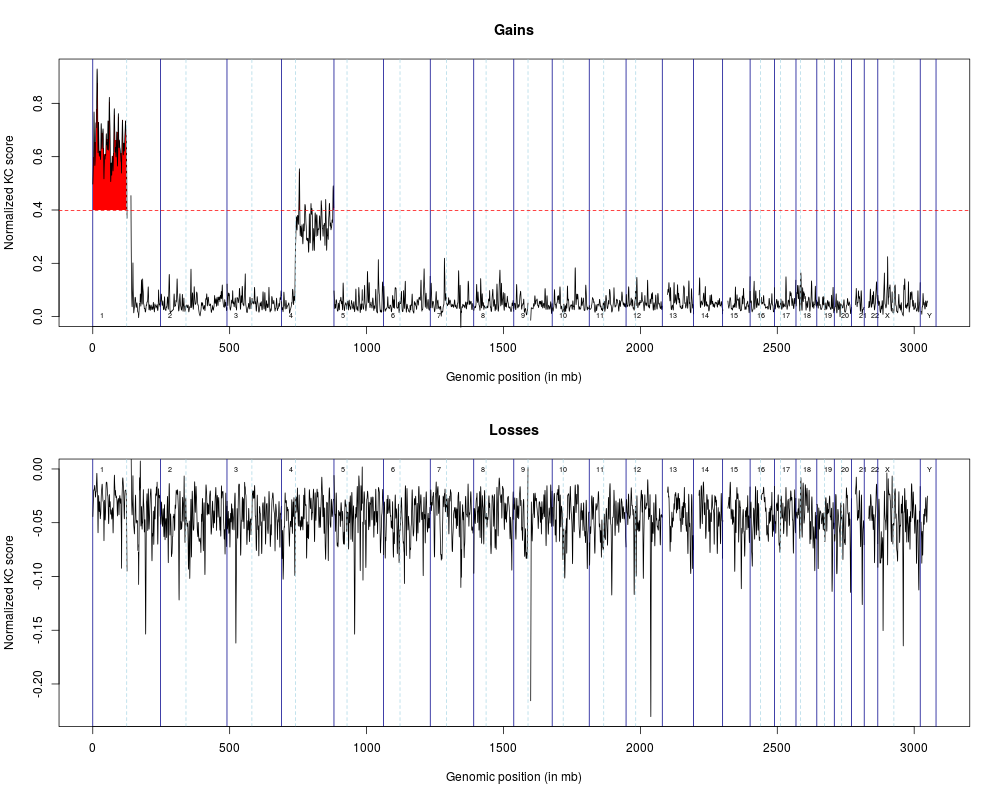
> plot(spm1mb, sigLevel=siglevel1mb)
>
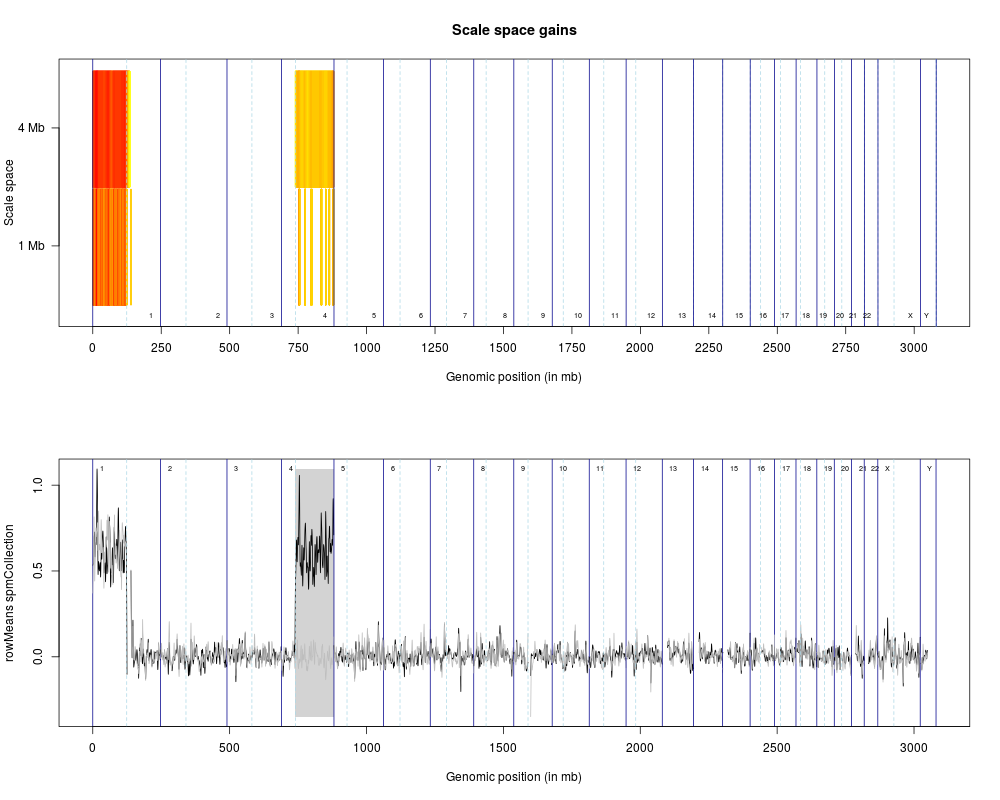
> plotScaleSpace(list(spm1mb, spm4mb), list(siglevel1mb, siglevel4mb), type='g')
>
> sigSegments1mb <- getSigSegments(spm1mb, siglevel1mb)
>
>
> spmc1mb <- calcSpmCollection(hsSampleData, hsMirrorLocs, cl=c(rep(0,10),rep(1,10)))
[1] "Mirror locations looking fine"
Processing sample 1 / 20 Processing sample 2 / 20 Processing sample 3 / 20 Processing sample 4 / 20 Processing sample 5 / 20 Processing sample 6 / 20 Processing sample 7 / 20 Processing sample 8 / 20 Processing sample 9 / 20 Processing sample 10 / 20 Processing sample 11 / 20 Processing sample 12 / 20 Processing sample 13 / 20 Processing sample 14 / 20 Processing sample 15 / 20 Processing sample 16 / 20 Processing sample 17 / 20 Processing sample 18 / 20 Processing sample 19 / 20 Processing sample 20 / 20
> spmcc1mb <- compareSpmCollection(spmc1mb, nperms=3)
Warning messages:
1: There are 3294 genes with at least one missing expression value.
The NAs are replaced by the gene-wise mean.
2: 3294 of the 3294 genes with at least one NA have no and 0 have one non-missing expression value.
All these 3294 genes are removed, and their d-values are set to NA.
> spmcc1mbSigRegions <- getSigRegionsCompKC(spmcc1mb)
Warning messages:
1: In findNumber(object, fdr, delta = delta, isSAM = isSAM, prec = prec, :
Since the FDR does not always decrease with increasing delta
the results of findDelta should be considered with caution.
2: In findNumber(object, fdr, delta = delta, isSAM = isSAM, prec = prec, :
Since the FDR does not always decrease with increasing delta
the results of findDelta should be considered with caution.
>
> plot(spmcc1mb, sigRegions=spmcc1mbSigRegions)
>
>
>
>
>
>
>
> dev.off()
null device
1
>
|