Supported by Dr. Osamu Ogasawara and  . . |
|
Last data update: 2014.03.03 |
KCsmart wrapperDescriptionWrapper function that calculates the sample point matrix from the aCGH data UsagecalcSpm(data, mirrorLocs, sigma = 1e+06, sampleDensity = 50000, maxmem = 1000, verbose=T, old=F) Arguments
Details'data' can be in cghRaw (CGHbase), DNAcopy or in data.frame format. When using the latter, the data.frame must have the following two columns: 'chrom' stating the chromosome the probe is located on, 'maploc' describing the position on the chromosome of the probe. The remainder of the data.frame will be interpreted as sample data points. The row names of that data will be used as probe names (when available). Important note: the data can not contain any missing values. If your data includes missing values you will need to preprocess (for example impute) it using other software solutions. The mirror locations for Homo Sapiens and Mus Musculus are provided in the package. These can be loaded using data(hsMirrorLocs) and data(mmMirrorLocs) respectively. The 'mirrorLocs' object is a list with vectors containing the start, centromere (optional) and end of each chromosome as the list elements. Additionally it should contain an attribute 'chromNames' listing the chromosome names of each respective list element. 'sigma' defines the kernel width of the kernel used to convolute the data. 'sampleDensity' defines the resolution of the sample point matrix to be calculated. A sampleDensity of 50000 would correspond to a sample point every 50k base pairs. 'old' can be used if you want to reproduce data that was generated with old (pre 2.9.0) versions of KCsmart, for any new analyses we recommend this flag to be set to false ValueReturns a sample point matrix object. The object has several slots of which the 'data' slot contains a list where each list item represents a chromosome. Each list item in turn contains the sample point matrix for the gains and the losses separately and an attribute specifying the corresponding chromosome. The sample point matrix contains the following additional slots: totalLength: Total length of the sample point matrix maxy and miny: Maximal and minimal score attained The other slots just represent the parameters used to calculate the sample point matrix. Use 'plot' to plot the sample point matrix and 'findSigLevelTrad' to find a significance threshold. 'plotScaleSpace' can be used to plot the significant regions of multiple sample point matrices (using different sigmas). Author(s)Jorma de Ronde See Also
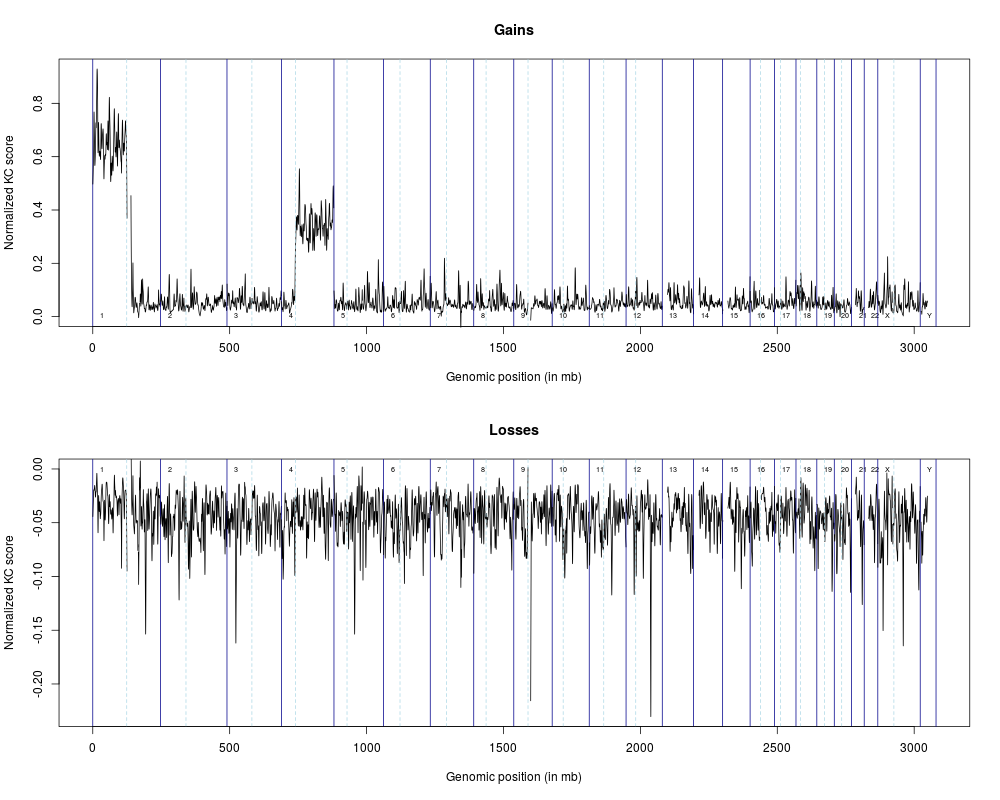
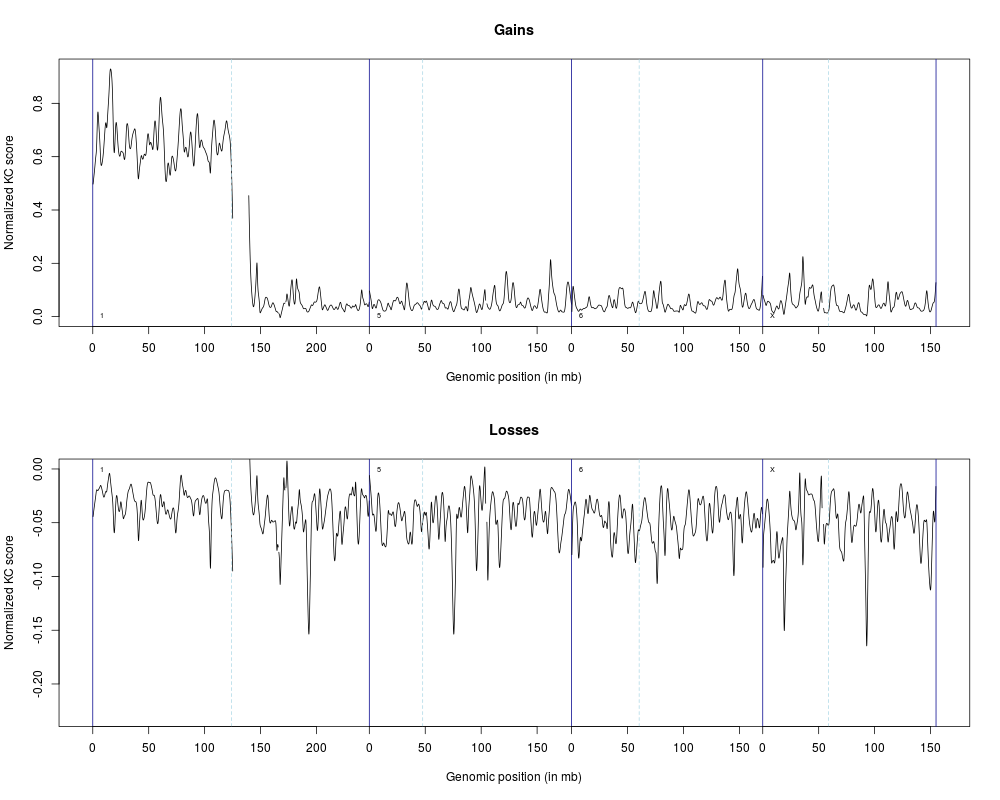
Examplesdata(hsSampleData) data(hsMirrorLocs) spm1mb <- calcSpm(hsSampleData, hsMirrorLocs) spm4mb <- calcSpm(hsSampleData, hsMirrorLocs, sigma=4000000) plot(spm1mb) plot(spm1mb, chromosomes=c(1,5,6,'X')) Results
R version 3.3.1 (2016-06-21) -- "Bug in Your Hair"
Copyright (C) 2016 The R Foundation for Statistical Computing
Platform: x86_64-pc-linux-gnu (64-bit)

R is free software and comes with ABSOLUTELY NO WARRANTY.
You are welcome to redistribute it under certain conditions.
Type 'license()' or 'licence()' for distribution details.

R is a collaborative project with many contributors.
Type 'contributors()' for more information and
'citation()' on how to cite R or R packages in publications.

Type 'demo()' for some demos, 'help()' for on-line help, or
'help.start()' for an HTML browser interface to help.
Type 'q()' to quit R.

> library(KCsmart)
Loading required package: siggenes
Loading required package: Biobase
Loading required package: BiocGenerics
Loading required package: parallel

Attaching package: 'BiocGenerics'

The following objects are masked from 'package:parallel':

    clusterApply, clusterApplyLB, clusterCall, clusterEvalQ,
    clusterExport, clusterMap, parApply, parCapply, parLapply,
    parLapplyLB, parRapply, parSapply, parSapplyLB

The following objects are masked from 'package:stats':

    IQR, mad, xtabs

The following objects are masked from 'package:base':

    Filter, Find, Map, Position, Reduce, anyDuplicated, append,
    as.data.frame, cbind, colnames, do.call, duplicated, eval, evalq,
    get, grep, grepl, intersect, is.unsorted, lapply, lengths, mapply,
    match, mget, order, paste, pmax, pmax.int, pmin, pmin.int, rank,
    rbind, rownames, sapply, setdiff, sort, table, tapply, union,
    unique, unsplit

Welcome to Bioconductor

    Vignettes contain introductory material; view with
    'browseVignettes()'. To cite Bioconductor, see
    'citation("Biobase")', and for packages 'citation("pkgname")'.

Loading required package: multtest
Loading required package: splines
Loading required package: KernSmooth
KernSmooth 2.23 loaded
Copyright M. P. Wand 1997-2009
> png(filename="/home/ddbj/snapshot/RGM3/R_BC/result/KCsmart/calcSpm.Rd_%03d_medium.png", width=480, height=480)
> ### Name: calcSpm
> ### Title: KCsmart wrapper
> ### Aliases: calcSpm
> ### Keywords: manip
>
> ### ** Examples
>
> data(hsSampleData)
> data(hsMirrorLocs)
>
> spm1mb <- calcSpm(hsSampleData, hsMirrorLocs)
[1] "Mirror locations looking fine"
[1] "Splitting data .."
[1] "Summing data .."
[1] "Mirroring data .."
[1] "Calculating sample point matrix .."

Processing chromosome 1

Processing chromosome 10

Processing chromosome 11

Processing chromosome 12

Processing chromosome 13

Processing chromosome 14

Processing chromosome 15

Processing chromosome 16

Processing chromosome 17

Processing chromosome 18

Processing chromosome 19

Processing chromosome 2

Processing chromosome 20

Processing chromosome 21

Processing chromosome 22

Processing chromosome 3

Processing chromosome 4

Processing chromosome 5

Processing chromosome 6

Processing chromosome 7

Processing chromosome 8

Processing chromosome 9

Processing chromosome X

Processing chromosome Y


[1] "Done"
> spm4mb <- calcSpm(hsSampleData, hsMirrorLocs, sigma=4000000)
[1] "Mirror locations looking fine"
[1] "Splitting data .."
[1] "Summing data .."
[1] "Mirroring data .."
[1] "Calculating sample point matrix .."

Processing chromosome 1

Processing chromosome 10

Processing chromosome 11

Processing chromosome 12

Processing chromosome 13

Processing chromosome 14

Processing chromosome 15

Processing chromosome 16

Processing chromosome 17

Processing chromosome 18

Processing chromosome 19

Processing chromosome 2

Processing chromosome 20

Processing chromosome 21

Processing chromosome 22

Processing chromosome 3

Processing chromosome 4

Processing chromosome 5

Processing chromosome 6

Processing chromosome 7

Processing chromosome 8

Processing chromosome 9

Processing chromosome X

Processing chromosome Y


[1] "Done"
>
> plot(spm1mb)
> plot(spm1mb, chromosomes=c(1,5,6,'X'))
>
>
>
>
>
> dev.off()
null device
          1
>
|