Supported by Dr. Osamu Ogasawara and  . . |
|
Last data update: 2014.03.03 |
KCsmart Comparative calculate null distributionDescriptionCompare the samples of one class in the sample point matrix collection to the samples in the other class and calculate the null distribution Usage
compareSpmCollection(spmCollection, nperms=20, method=c("siggenes", "perm"), siggenes.args=NULL, altcl=NULL)
Arguments
DetailsThe method to be used to determine significant regions can either be the SAM methodology from the siggenes package or a signal-to-noise/permutation based method. For more information regarding the siggenes method please check the corresponding package. ValueReturns a compKc object which returns the original data and, depending on the method used, the permuted data or the fdr-delta value combinations as calculated by the siggenes package. Author(s)Jorma de Ronde See Also
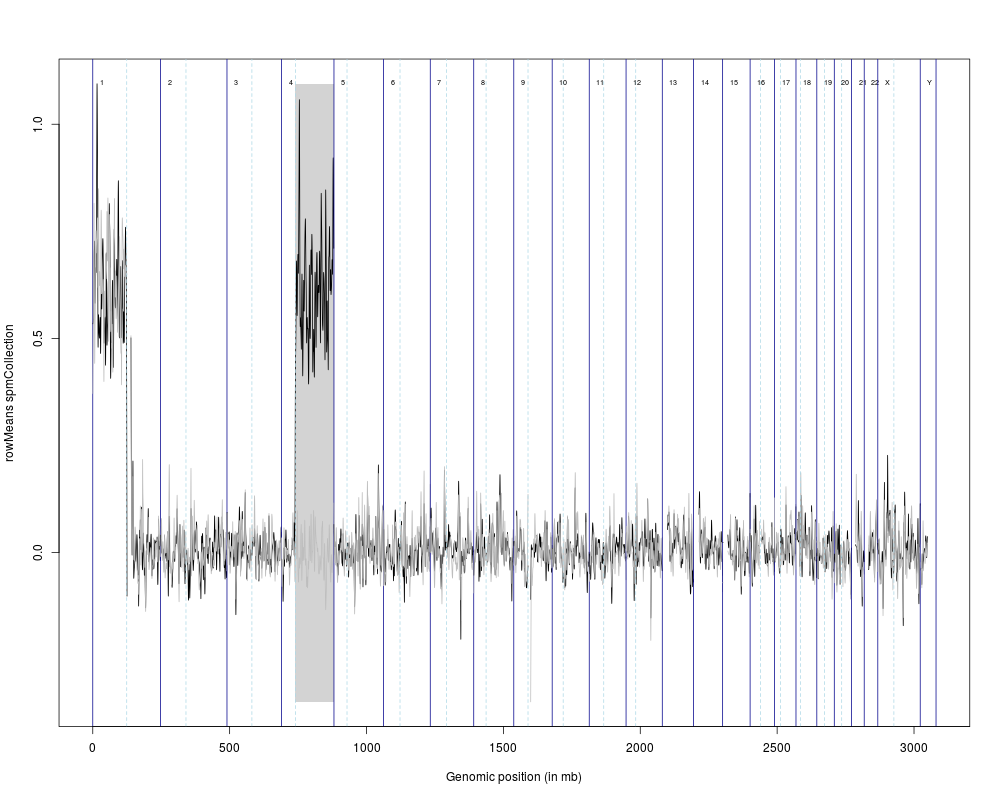
Examplesdata(hsSampleData) data(hsMirrorLocs) spmc1mb <- calcSpmCollection(hsSampleData, hsMirrorLocs, cl=c(rep(0,10),rep(1,10))) spmcc1mb <- compareSpmCollection(spmc1mb, nperms=3) spmcc1mbSigRegions <- getSigRegionsCompKC(spmcc1mb) plot(spmcc1mb, sigRegions=spmcc1mbSigRegions) Results
R version 3.3.1 (2016-06-21) -- "Bug in Your Hair"
Copyright (C) 2016 The R Foundation for Statistical Computing
Platform: x86_64-pc-linux-gnu (64-bit)

R is free software and comes with ABSOLUTELY NO WARRANTY.
You are welcome to redistribute it under certain conditions.
Type 'license()' or 'licence()' for distribution details.

R is a collaborative project with many contributors.
Type 'contributors()' for more information and
'citation()' on how to cite R or R packages in publications.

Type 'demo()' for some demos, 'help()' for on-line help, or
'help.start()' for an HTML browser interface to help.
Type 'q()' to quit R.

> library(KCsmart)
Loading required package: siggenes
Loading required package: Biobase
Loading required package: BiocGenerics
Loading required package: parallel

Attaching package: 'BiocGenerics'

The following objects are masked from 'package:parallel':

    clusterApply, clusterApplyLB, clusterCall, clusterEvalQ,
    clusterExport, clusterMap, parApply, parCapply, parLapply,
    parLapplyLB, parRapply, parSapply, parSapplyLB

The following objects are masked from 'package:stats':

    IQR, mad, xtabs

The following objects are masked from 'package:base':

    Filter, Find, Map, Position, Reduce, anyDuplicated, append,
    as.data.frame, cbind, colnames, do.call, duplicated, eval, evalq,
    get, grep, grepl, intersect, is.unsorted, lapply, lengths, mapply,
    match, mget, order, paste, pmax, pmax.int, pmin, pmin.int, rank,
    rbind, rownames, sapply, setdiff, sort, table, tapply, union,
    unique, unsplit

Welcome to Bioconductor

    Vignettes contain introductory material; view with
    'browseVignettes()'. To cite Bioconductor, see
    'citation("Biobase")', and for packages 'citation("pkgname")'.

Loading required package: multtest
Loading required package: splines
Loading required package: KernSmooth
KernSmooth 2.23 loaded
Copyright M. P. Wand 1997-2009
> png(filename="/home/ddbj/snapshot/RGM3/R_BC/result/KCsmart/compareSpmCollection.Rd_%03d_medium.png", width=480, height=480)
> ### Name: compareSpmCollection
> ### Title: KCsmart Comparative calculate null distribution
> ### Aliases: compareSpmCollection
> ### Keywords: manip
>
> ### ** Examples
>
> data(hsSampleData)
> data(hsMirrorLocs)
>
> spmc1mb <- calcSpmCollection(hsSampleData, hsMirrorLocs, cl=c(rep(0,10),rep(1,10)))
[1] "Mirror locations looking fine"
Processing sample 1 / 20  Processing sample 2 / 20  Processing sample 3 / 20  Processing sample 4 / 20  Processing sample 5 / 20  Processing sample 6 / 20  Processing sample 7 / 20  Processing sample 8 / 20  Processing sample 9 / 20  Processing sample 10 / 20  Processing sample 11 / 20  Processing sample 12 / 20  Processing sample 13 / 20  Processing sample 14 / 20  Processing sample 15 / 20  Processing sample 16 / 20  Processing sample 17 / 20  Processing sample 18 / 20  Processing sample 19 / 20  Processing sample 20 / 20
> spmcc1mb <- compareSpmCollection(spmc1mb, nperms=3)
Warning messages:
1: There are 3294 genes with at least one missing expression value.
The NAs are replaced by the gene-wise mean.
2: 3294 of the 3294 genes with at least one NA have no and 0 have one non-missing expression value.
All these 3294 genes are removed, and their d-values are set to NA.
> spmcc1mbSigRegions <- getSigRegionsCompKC(spmcc1mb)
>
> plot(spmcc1mb, sigRegions=spmcc1mbSigRegions)
>
>
>
>
>
>
> dev.off()
null device
          1
>
|