Supported by Dr. Osamu Ogasawara and  . . |
|
Last data update: 2014.03.03 |
This function has not been properly implemented yetDescriptionMethod to find the cutoff at which gains and losses are considered significant using permutations UsagefindSigLevelFdr(data, observedSpm, n = 1, fdrTarget=0.05, maxmem=1000) Arguments
DetailsThe number of permutations needed for reliable results depends on the data and can not be determined beforehand. As a general rule-of-thumb around 100 permutations should be used for 'quick checks' and around 2000 permutations for more rigorous testing. The FDR method is less conservatie than the p-value based approach since instead of controlling the family wise error rate (FWER, P(false positive > 1)) it controls the false discovery rate (FDR) (false positives / total number of called data points). ValueA list with the cutoffs corresponding to the given FDR
Author(s)Jorma de Ronde See Also
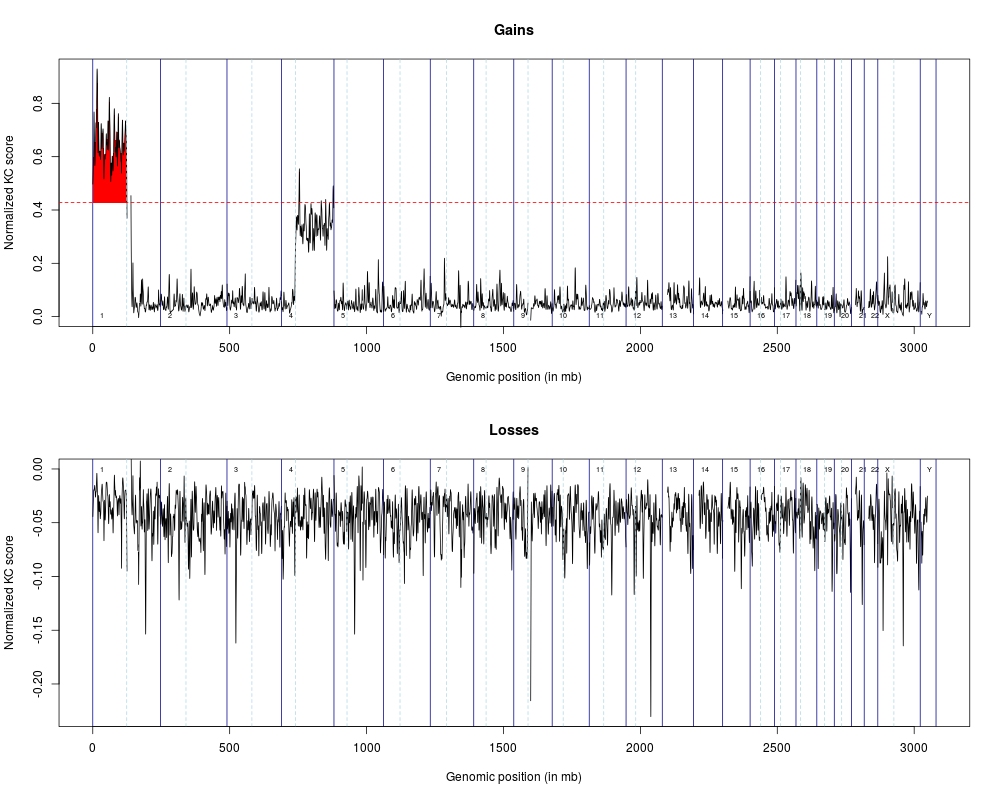
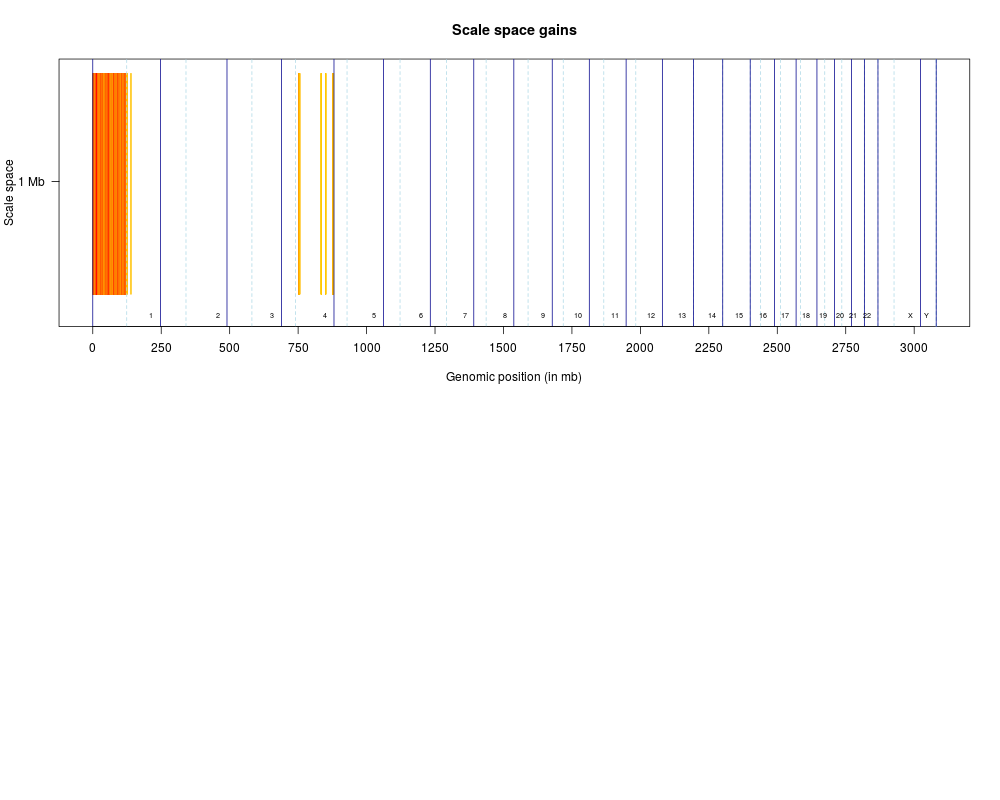
Examplesdata(hsSampleData) data(hsMirrorLocs) spm1mb <- calcSpm(hsSampleData, hsMirrorLocs) sigLevel1mb <- findSigLevelTrad(hsSampleData, spm1mb, n=3) plot(spm1mb, sigLevels=sigLevel1mb) plotScaleSpace(list(spm1mb), list(sigLevel1mb), type='g') Results
R version 3.3.1 (2016-06-21) -- "Bug in Your Hair"
Copyright (C) 2016 The R Foundation for Statistical Computing
Platform: x86_64-pc-linux-gnu (64-bit)

R is free software and comes with ABSOLUTELY NO WARRANTY.
You are welcome to redistribute it under certain conditions.
Type 'license()' or 'licence()' for distribution details.

R is a collaborative project with many contributors.
Type 'contributors()' for more information and
'citation()' on how to cite R or R packages in publications.

Type 'demo()' for some demos, 'help()' for on-line help, or
'help.start()' for an HTML browser interface to help.
Type 'q()' to quit R.

> library(KCsmart)
Loading required package: siggenes
Loading required package: Biobase
Loading required package: BiocGenerics
Loading required package: parallel

Attaching package: 'BiocGenerics'

The following objects are masked from 'package:parallel':

    clusterApply, clusterApplyLB, clusterCall, clusterEvalQ,
    clusterExport, clusterMap, parApply, parCapply, parLapply,
    parLapplyLB, parRapply, parSapply, parSapplyLB

The following objects are masked from 'package:stats':

    IQR, mad, xtabs

The following objects are masked from 'package:base':

    Filter, Find, Map, Position, Reduce, anyDuplicated, append,
    as.data.frame, cbind, colnames, do.call, duplicated, eval, evalq,
    get, grep, grepl, intersect, is.unsorted, lapply, lengths, mapply,
    match, mget, order, paste, pmax, pmax.int, pmin, pmin.int, rank,
    rbind, rownames, sapply, setdiff, sort, table, tapply, union,
    unique, unsplit

Welcome to Bioconductor

    Vignettes contain introductory material; view with
    'browseVignettes()'. To cite Bioconductor, see
    'citation("Biobase")', and for packages 'citation("pkgname")'.

Loading required package: multtest
Loading required package: splines
Loading required package: KernSmooth
KernSmooth 2.23 loaded
Copyright M. P. Wand 1997-2009
> png(filename="/home/ddbj/snapshot/RGM3/R_BC/result/KCsmart/findSigLevelFdr.Rd_%03d_medium.png", width=480, height=480)
> ### Name: findSigLevelFdr
> ### Title: This function has not been properly implemented yet
> ### Aliases: findSigLevelFdr
> ### Keywords: manip
>
> ### ** Examples
>
> data(hsSampleData)
> data(hsMirrorLocs)
>
> spm1mb <- calcSpm(hsSampleData, hsMirrorLocs)
[1] "Mirror locations looking fine"
[1] "Splitting data .."
[1] "Summing data .."
[1] "Mirroring data .."
[1] "Calculating sample point matrix .."

Processing chromosome 1

Processing chromosome 10

Processing chromosome 11

Processing chromosome 12

Processing chromosome 13

Processing chromosome 14

Processing chromosome 15

Processing chromosome 16

Processing chromosome 17

Processing chromosome 18

Processing chromosome 19

Processing chromosome 2

Processing chromosome 20

Processing chromosome 21

Processing chromosome 22

Processing chromosome 3

Processing chromosome 4

Processing chromosome 5

Processing chromosome 6

Processing chromosome 7

Processing chromosome 8

Processing chromosome 9

Processing chromosome X

Processing chromosome Y


[1] "Done"
>
> sigLevel1mb <- findSigLevelTrad(hsSampleData, spm1mb, n=3)
[1] "Calculating alpha =  0.05 significance cut-off"
[1] "Found  584  pos peaks and  598  neg peaks in observed sample point matrix"
[1] "Calculating Mirror Positions"
[1] "Starting permutations .."
 At iteration 1 of 3[1] "Permuting"
[1] "Combining"
[1] "Returning"
 At iteration 2 of 3[1] "Permuting"
[1] "Combining"
[1] "Returning"
 At iteration 3 of 3[1] "Permuting"
[1] "Combining"
[1] "Returning"

>
> plot(spm1mb, sigLevels=sigLevel1mb)
> plotScaleSpace(list(spm1mb), list(sigLevel1mb), type='g')
>
>
>
>
>
> dev.off()
null device
          1
>
|