Supported by Dr. Osamu Ogasawara and  . . |
|
Last data update: 2014.03.03 |
Plot multiple significant regions in one figureDescriptionPlots significant regions in different scale spaces in one figure UsageplotScaleSpace(spms, sigLevels, chromosomes=NULL, type='b') Arguments
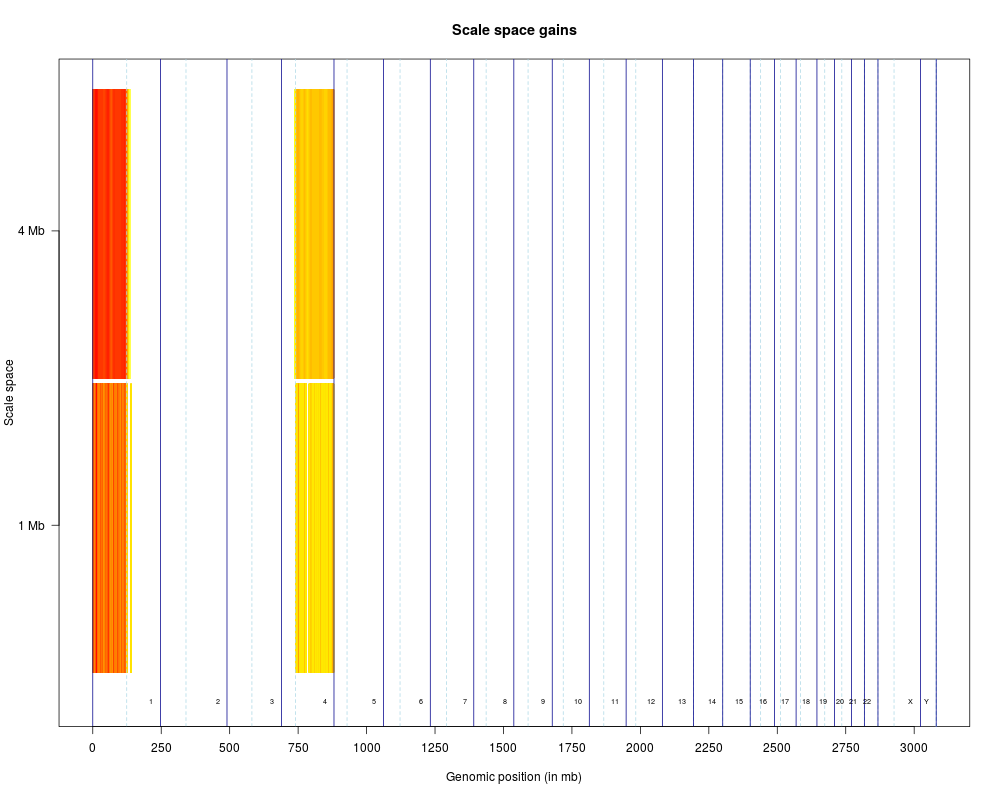
DetailsTakes sample point matrices that were calculated using (different) kernel widths (sigma), then calculates the significant regions given the cutoffs as defined by 'sigLevels' and plots these in one figure. ValueDepending on the 'type' parameter, produces one or two plots, one for the gains and one for the losses. The heatmap color indicates the level of the gain or loss. Author(s)Jorma de Ronde See Also
Examplesdata(hsSampleData) data(hsMirrorLocs) spm1mb <- calcSpm(hsSampleData, hsMirrorLocs) spm4mb <- calcSpm(hsSampleData, hsMirrorLocs, sigma=4000000) siglevel1mb <- findSigLevelTrad(hsSampleData, spm1mb, n=3) siglevel4mb <- findSigLevelTrad(hsSampleData, spm4mb, n=3) plotScaleSpace(list(spm1mb, spm4mb), list(siglevel1mb, siglevel4mb), type='g') Results
R version 3.3.1 (2016-06-21) -- "Bug in Your Hair"
Copyright (C) 2016 The R Foundation for Statistical Computing
Platform: x86_64-pc-linux-gnu (64-bit)

R is free software and comes with ABSOLUTELY NO WARRANTY.
You are welcome to redistribute it under certain conditions.
Type 'license()' or 'licence()' for distribution details.

R is a collaborative project with many contributors.
Type 'contributors()' for more information and
'citation()' on how to cite R or R packages in publications.

Type 'demo()' for some demos, 'help()' for on-line help, or
'help.start()' for an HTML browser interface to help.
Type 'q()' to quit R.

> library(KCsmart)
Loading required package: siggenes
Loading required package: Biobase
Loading required package: BiocGenerics
Loading required package: parallel

Attaching package: 'BiocGenerics'

The following objects are masked from 'package:parallel':

    clusterApply, clusterApplyLB, clusterCall, clusterEvalQ,
    clusterExport, clusterMap, parApply, parCapply, parLapply,
    parLapplyLB, parRapply, parSapply, parSapplyLB

The following objects are masked from 'package:stats':

    IQR, mad, xtabs

The following objects are masked from 'package:base':

    Filter, Find, Map, Position, Reduce, anyDuplicated, append,
    as.data.frame, cbind, colnames, do.call, duplicated, eval, evalq,
    get, grep, grepl, intersect, is.unsorted, lapply, lengths, mapply,
    match, mget, order, paste, pmax, pmax.int, pmin, pmin.int, rank,
    rbind, rownames, sapply, setdiff, sort, table, tapply, union,
    unique, unsplit

Welcome to Bioconductor

    Vignettes contain introductory material; view with
    'browseVignettes()'. To cite Bioconductor, see
    'citation("Biobase")', and for packages 'citation("pkgname")'.

Loading required package: multtest
Loading required package: splines
Loading required package: KernSmooth
KernSmooth 2.23 loaded
Copyright M. P. Wand 1997-2009
> png(filename="/home/ddbj/snapshot/RGM3/R_BC/result/KCsmart/plotScaleSpace.Rd_%03d_medium.png", width=480, height=480)
> ### Name: plotScaleSpace
> ### Title: Plot multiple significant regions in one figure
> ### Aliases: plotScaleSpace
> ### Keywords: hplot
>
> ### ** Examples
>
> data(hsSampleData)
> data(hsMirrorLocs)
>
> spm1mb <- calcSpm(hsSampleData, hsMirrorLocs)
[1] "Mirror locations looking fine"
[1] "Splitting data .."
[1] "Summing data .."
[1] "Mirroring data .."
[1] "Calculating sample point matrix .."

Processing chromosome 1

Processing chromosome 10

Processing chromosome 11

Processing chromosome 12

Processing chromosome 13

Processing chromosome 14

Processing chromosome 15

Processing chromosome 16

Processing chromosome 17

Processing chromosome 18

Processing chromosome 19

Processing chromosome 2

Processing chromosome 20

Processing chromosome 21

Processing chromosome 22

Processing chromosome 3

Processing chromosome 4

Processing chromosome 5

Processing chromosome 6

Processing chromosome 7

Processing chromosome 8

Processing chromosome 9

Processing chromosome X

Processing chromosome Y


[1] "Done"
> spm4mb <- calcSpm(hsSampleData, hsMirrorLocs, sigma=4000000)
[1] "Mirror locations looking fine"
[1] "Splitting data .."
[1] "Summing data .."
[1] "Mirroring data .."
[1] "Calculating sample point matrix .."

Processing chromosome 1

Processing chromosome 10

Processing chromosome 11

Processing chromosome 12

Processing chromosome 13

Processing chromosome 14

Processing chromosome 15

Processing chromosome 16

Processing chromosome 17

Processing chromosome 18

Processing chromosome 19

Processing chromosome 2

Processing chromosome 20

Processing chromosome 21

Processing chromosome 22

Processing chromosome 3

Processing chromosome 4

Processing chromosome 5

Processing chromosome 6

Processing chromosome 7

Processing chromosome 8

Processing chromosome 9

Processing chromosome X

Processing chromosome Y


[1] "Done"
>
> siglevel1mb <- findSigLevelTrad(hsSampleData, spm1mb, n=3)
[1] "Calculating alpha =  0.05 significance cut-off"
[1] "Found  584  pos peaks and  598  neg peaks in observed sample point matrix"
[1] "Calculating Mirror Positions"
[1] "Starting permutations .."
 At iteration 1 of 3[1] "Permuting"
[1] "Combining"
[1] "Returning"
 At iteration 2 of 3[1] "Permuting"
[1] "Combining"
[1] "Returning"
 At iteration 3 of 3[1] "Permuting"
[1] "Combining"
[1] "Returning"

> siglevel4mb <- findSigLevelTrad(hsSampleData, spm4mb, n=3)
[1] "Calculating alpha =  0.05 significance cut-off"
[1] "Found  169  pos peaks and  174  neg peaks in observed sample point matrix"
[1] "Calculating Mirror Positions"
[1] "Starting permutations .."
 At iteration 1 of 3[1] "Permuting"
[1] "Combining"
[1] "Returning"
 At iteration 2 of 3[1] "Permuting"
[1] "Combining"
[1] "Returning"
 At iteration 3 of 3[1] "Permuting"
[1] "Combining"
[1] "Returning"

>
> plotScaleSpace(list(spm1mb, spm4mb), list(siglevel1mb, siglevel4mb), type='g')
>
>
>
>
>
> dev.off()
null device
          1
>
|