Supported by Dr. Osamu Ogasawara and  . . |
|
Last data update: 2014.03.03 |
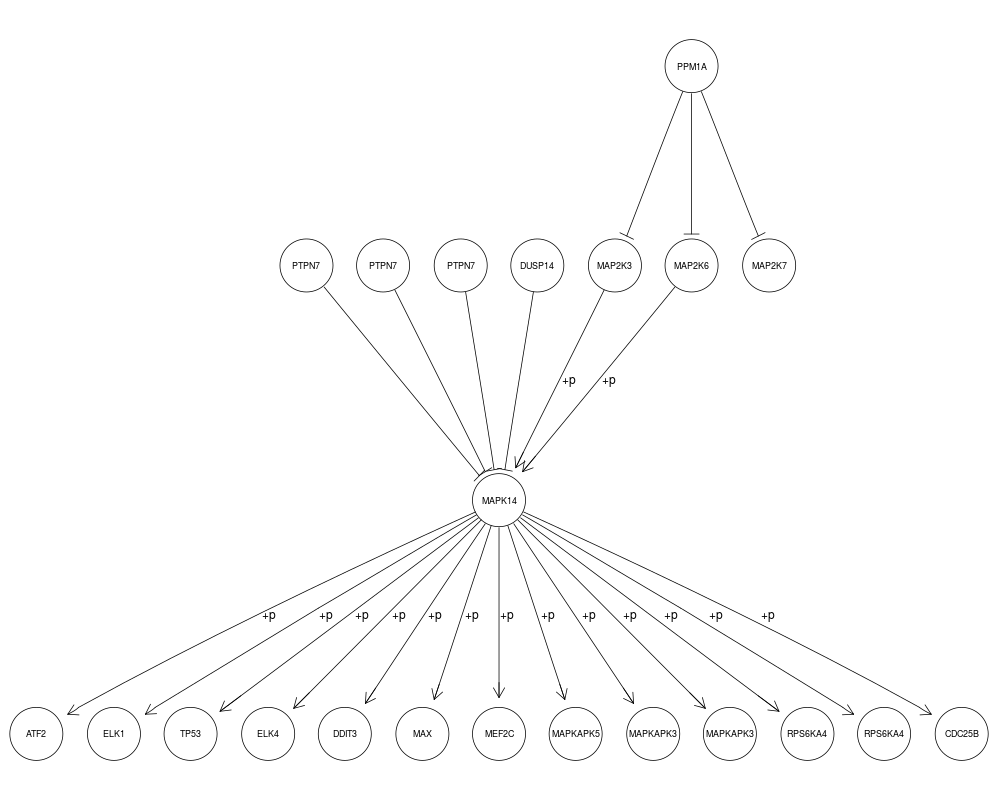
Plot KEGG graph with RgraphvizDescriptionThe function provides a simple interface to Rgraphviz to render KEGG graph with custom styles.
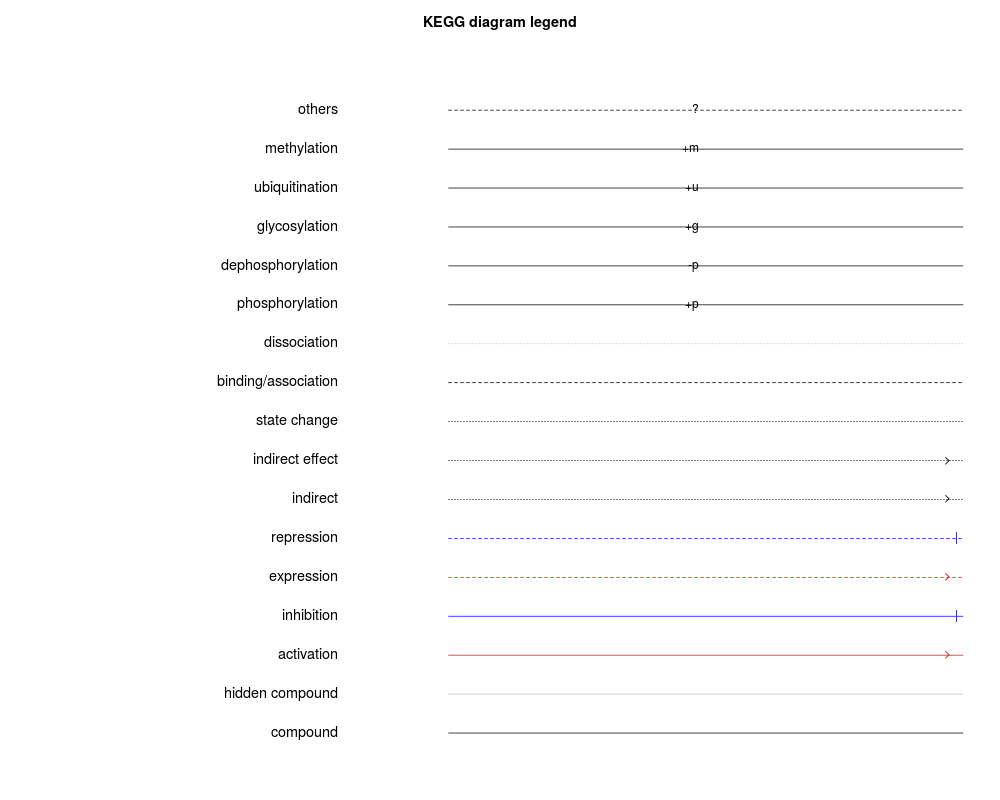
UsageplotKEGGgraph(graph, y = "neato", shortLabel = TRUE, useDisplayName=TRUE, nodeRenderInfos, ...) KEGGgraphLegend() Arguments
DetailsUsers are not restricted to this function, alternatively you can choose other rendering functions. ValueThe graph after layout and rendering is returned. Author(s)Jitao David Zhang mailto:jitao_david.zhang@roche.com Examples
opar <- par(ask=TRUE)
sfile <- system.file("extdata/hsa04010.xml",package="KEGGgraph")
gR <- parseKGML2Graph(sfile,expandGenes=TRUE)
subs <-  c("hsa:1432",edges(gR)$`hsa:1432`,"hsa:5778","hsa:5801","hsa:84867","hsa:11072","hsa:5606","hsa:5608","hsa:5494","hsa:5609")
gR.sub <- subGraph(subs, gR)
if(require(Rgraphviz))
  plotKEGGgraph(gR.sub)

KEGGgraphLegend()
par(opar)
Results
R version 3.3.1 (2016-06-21) -- "Bug in Your Hair"
Copyright (C) 2016 The R Foundation for Statistical Computing
Platform: x86_64-pc-linux-gnu (64-bit)

R is free software and comes with ABSOLUTELY NO WARRANTY.
You are welcome to redistribute it under certain conditions.
Type 'license()' or 'licence()' for distribution details.

R is a collaborative project with many contributors.
Type 'contributors()' for more information and
'citation()' on how to cite R or R packages in publications.

Type 'demo()' for some demos, 'help()' for on-line help, or
'help.start()' for an HTML browser interface to help.
Type 'q()' to quit R.

> library(KEGGgraph)

Attaching package: 'KEGGgraph'

The following object is masked from 'package:graphics':

    plot

> png(filename="/home/ddbj/snapshot/RGM3/R_BC/result/KEGGgraph/plotKEGGgraph.Rd_%03d_medium.png", width=480, height=480)
> ### Name: plotKEGGgraph
> ### Title: Plot KEGG graph with Rgraphviz
> ### Aliases: plotKEGGgraph KEGGgraphLegend
>
> ### ** Examples
>
> opar <- par(ask=TRUE)
> sfile <- system.file("extdata/hsa04010.xml",package="KEGGgraph")
> gR <- parseKGML2Graph(sfile,expandGenes=TRUE)
> subs <-  c("hsa:1432",edges(gR)$`hsa:1432`,"hsa:5778","hsa:5801","hsa:84867","hsa:11072","hsa:5606","hsa:5608","hsa:5494","hsa:5609")
> gR.sub <- subGraph(subs, gR)
> if(require(Rgraphviz))
+   plotKEGGgraph(gR.sub)
Loading required package: Rgraphviz
Loading required package: graph
Loading required package: BiocGenerics
Loading required package: parallel

Attaching package: 'BiocGenerics'

The following objects are masked from 'package:parallel':

    clusterApply, clusterApplyLB, clusterCall, clusterEvalQ,
    clusterExport, clusterMap, parApply, parCapply, parLapply,
    parLapplyLB, parRapply, parSapply, parSapplyLB

The following objects are masked from 'package:stats':

    IQR, mad, xtabs

The following objects are masked from 'package:base':

    Filter, Find, Map, Position, Reduce, anyDuplicated, append,
    as.data.frame, cbind, colnames, do.call, duplicated, eval, evalq,
    get, grep, grepl, intersect, is.unsorted, lapply, lengths, mapply,
    match, mget, order, paste, pmax, pmax.int, pmin, pmin.int, rank,
    rbind, rownames, sapply, setdiff, sort, table, tapply, union,
    unique, unsplit

Loading required package: grid
>
> KEGGgraphLegend()
> par(opar)
>
>
>
>
>
> dev.off()
null device
          1
>
|
Created & Maintained by Osamu Ogasawara (osamu.ogasawara@gmail.com) and 