Supported by Dr. Osamu Ogasawara and  . . |
|
Last data update: 2014.03.03 |
col_by_valueDescriptionThe function will transfer a numeric matrix into a matrix of colors, in which the colors represent the values of numeric matrix Usagecol_by_value(x, col, range = NA, breaks = NA, showColorBar = T) Arguments
DetailsA colorbar would also be ploted. The returned colors of the function can be used in function plot_profile. if breaks not equal to NA, col must have the same length with breaks-1. Valuea matrix equal to x, but the values were instead by colors. Examples
data(pho_sites_count)
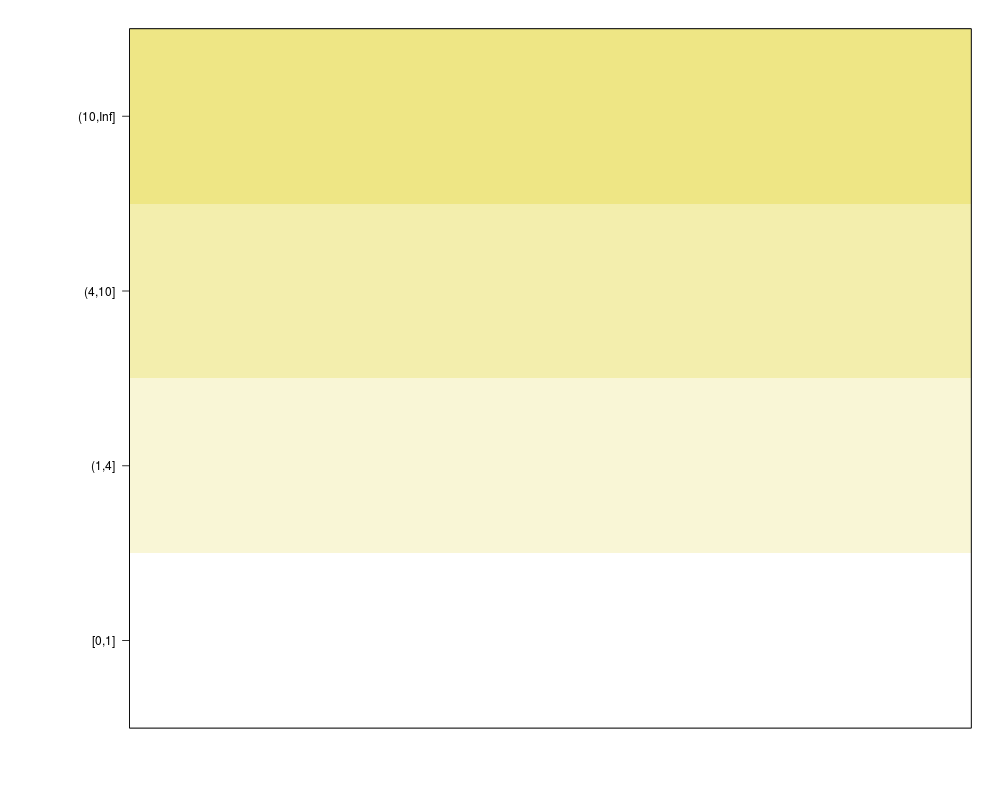
col<-col_by_value(pho_sites_count,col=colorRampPalette(c('white','khaki2'))(4),breaks=c(0,1,4,10,Inf))
Results
R version 3.3.1 (2016-06-21) -- "Bug in Your Hair"
Copyright (C) 2016 The R Foundation for Statistical Computing
Platform: x86_64-pc-linux-gnu (64-bit)

R is free software and comes with ABSOLUTELY NO WARRANTY.
You are welcome to redistribute it under certain conditions.
Type 'license()' or 'licence()' for distribution details.

R is a collaborative project with many contributors.
Type 'contributors()' for more information and
'citation()' on how to cite R or R packages in publications.

Type 'demo()' for some demos, 'help()' for on-line help, or
'help.start()' for an HTML browser interface to help.
Type 'q()' to quit R.

> library(KEGGprofile)

KEGG.db contains mappings based on older data because the original
  resource was removed from the the public domain before the most
  recent update was produced. This package should now be considered
  deprecated and future versions of Bioconductor may not have it
  available.  Users who want more current data are encouraged to look
  at the KEGGREST or reactome.db packages

> png(filename="/home/ddbj/snapshot/RGM3/R_BC/result/KEGGprofile/col_by_value.Rd_%03d_medium.png", width=480, height=480)
> ### Name: col_by_value
> ### Title: col_by_value
> ### Aliases: col_by_value
>
> ### ** Examples
>
> data(pho_sites_count)
> col<-col_by_value(pho_sites_count,col=colorRampPalette(c('white','khaki2'))(4),breaks=c(0,1,4,10,Inf))
>
>
>
>
>
> dev.off()
null device
          1
>
|
Created & Maintained by Osamu Ogasawara (osamu.ogasawara@gmail.com) and 