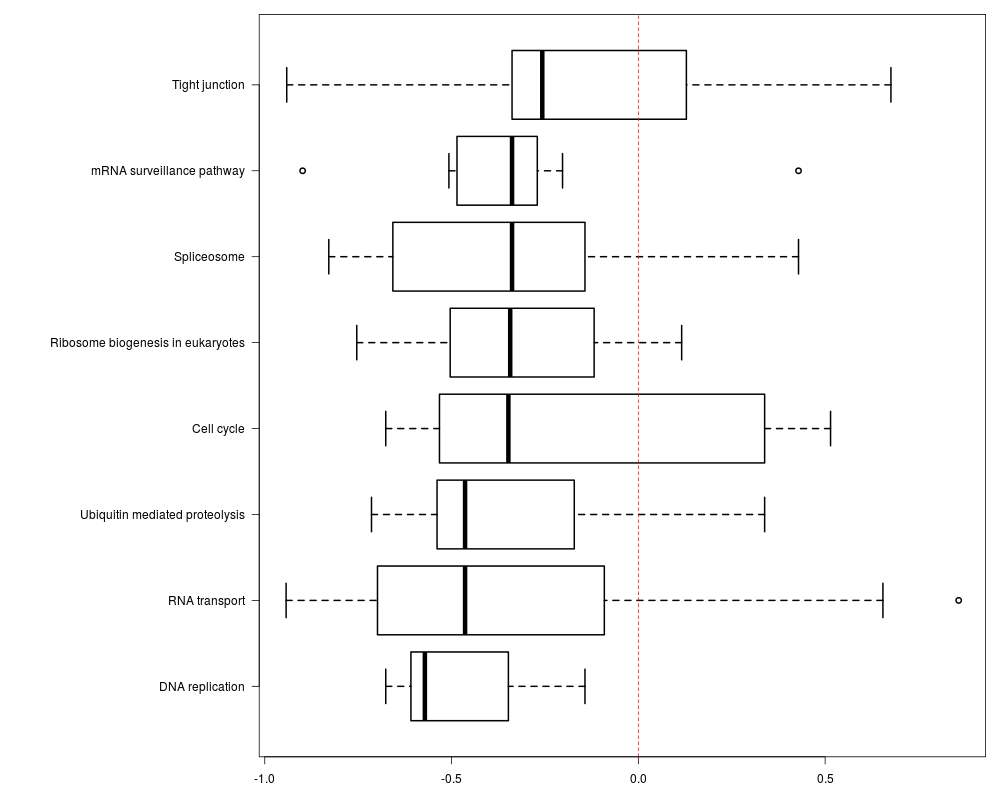
The function will plot the correlation distributions for each enriched pathway (result from find_enriched_pathway function), and then Wilcoxon tests would be used to estimate the significance of correlations distribution between genes in each pathway and all genes.
Usage
plot_pathway_cor(gene_expr, kegg_enriched_pathway, groups = NULL,
  side = c("both", "pos", "neg"), alternative = NULL)
Arguments
gene_expr
the matrix for gene expression, row.names should be NCBI gene ID, such as 67040, 93683
kegg_enriched_pathway
The returned value from find_enriched_pathway function, the enriched pathways.
groups
a character used to indicate expression values from different types of samples
side
a character string specifying the correlation directions interested, must be one of "both" (default), "pos" or "neg".
alternative
a character string specifying the alternative hypothesis, must be one of "two.sided" (default), "greater" or "less". You can specify just the initial letter.
R version 3.3.1 (2016-06-21) -- "Bug in Your Hair"
Copyright (C) 2016 The R Foundation for Statistical Computing
Platform: x86_64-pc-linux-gnu (64-bit)

R is free software and comes with ABSOLUTELY NO WARRANTY.
You are welcome to redistribute it under certain conditions.
Type 'license()' or 'licence()' for distribution details.

R is a collaborative project with many contributors.
Type 'contributors()' for more information and
'citation()' on how to cite R or R packages in publications.

Type 'demo()' for some demos, 'help()' for on-line help, or
'help.start()' for an HTML browser interface to help.
Type 'q()' to quit R.

> library(KEGGprofile)

KEGG.db contains mappings based on older data because the original
  resource was removed from the the public domain before the most
  recent update was produced. This package should now be considered
  deprecated and future versions of Bioconductor may not have it
  available.  Users who want more current data are encouraged to look
  at the KEGGREST or reactome.db packages

> png(filename="/home/ddbj/snapshot/RGM3/R_BC/result/KEGGprofile/plot_pathway_cor.Rd_%03d_medium.png", width=480, height=480)
> ### Name: plot_pathway_cor
> ### Title: plot_pathway_cor
> ### Aliases: plot_pathway_cor
>
> ### ** Examples
>
> data(pro_pho_expr)
> data(pho_sites_count)
> genes<-row.names(pho_sites_count)[which(pho_sites_count>=10)]
> pho_KEGGresult<-find_enriched_pathway(genes,species='hsa')
> result<-plot_pathway_cor(gene_expr=pro_pho_expr,kegg_enriched_pathway=pho_KEGGresult)
>
>
>
>
>
> dev.off()
null device
          1
>
 .
.