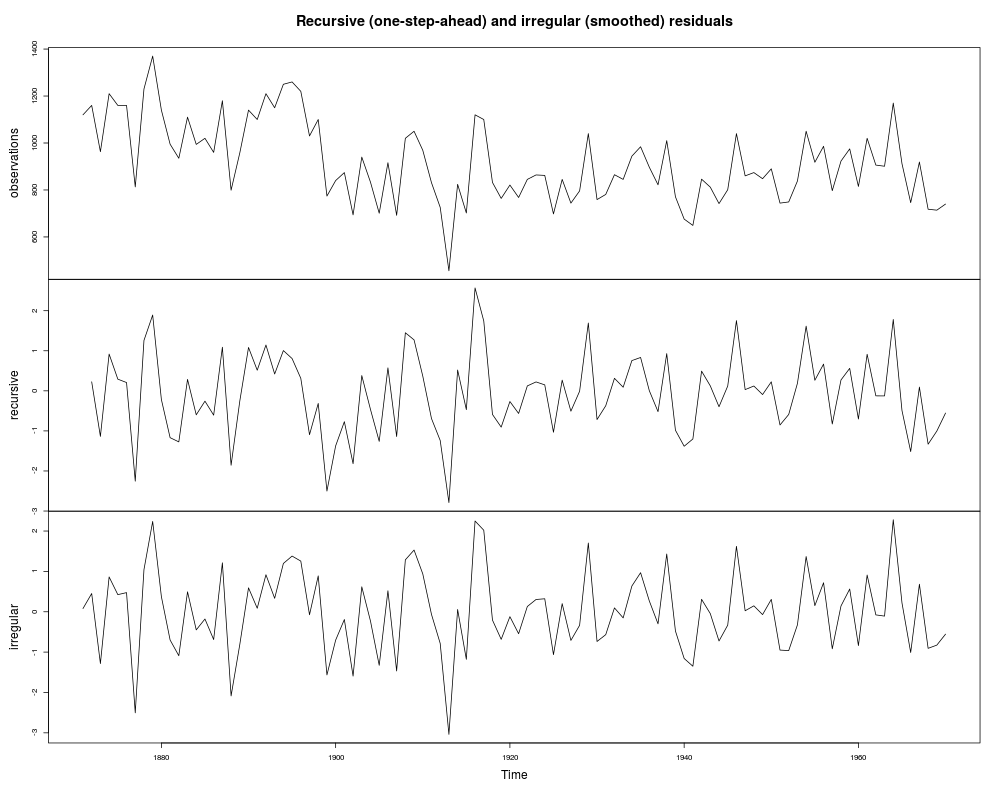
Diagnostic plots based on standardized residuals for objects of class SSModel.
Usage
## S3 method for class 'SSModel'
plot(x, nsim = 0, ...)
Arguments
x
Object of class SSModel.
nsim
The number of independent samples used in importance sampling.
Only used for non-Gaussian model. Default is 0, which computes the
approximating Gaussian model by approxSSM and performs the
usual Gaussian filtering/smoothing so that the smoothed state estimates
equals to the conditional mode of p(α[t]|y).
In case of nsim = 0, the mean estimates and their variances are computed using
the Delta method (ignoring the covariance terms).
...
Ignored.
Examples
modelNile <- SSModel(Nile ~ SSMtrend(1, Q = list(matrix(NA))), H = matrix(NA))
modelNile <- fitSSM(inits = c(log(var(Nile)),log(var(Nile))), model = modelNile,
 method = "BFGS")$model

if (interactive()) {
  plot(modelNile)
}
Results
R version 3.3.1 (2016-06-21) -- "Bug in Your Hair"
Copyright (C) 2016 The R Foundation for Statistical Computing
Platform: x86_64-pc-linux-gnu (64-bit)

R is free software and comes with ABSOLUTELY NO WARRANTY.
You are welcome to redistribute it under certain conditions.
Type 'license()' or 'licence()' for distribution details.

R is a collaborative project with many contributors.
Type 'contributors()' for more information and
'citation()' on how to cite R or R packages in publications.

Type 'demo()' for some demos, 'help()' for on-line help, or
'help.start()' for an HTML browser interface to help.
Type 'q()' to quit R.

> library(KFAS)
> png(filename="/home/ddbj/snapshot/RGM3/R_CC/result/KFAS/plot.SSModel.Rd_%03d_medium.png", width=480, height=480)
> ### Name: plot.SSModel
> ### Title: Diagnostic Plots of State Space Models
> ### Aliases: plot.SSModel
>
> ### ** Examples
>
> modelNile <- SSModel(Nile ~ SSMtrend(1, Q = list(matrix(NA))), H = matrix(NA))
> modelNile <- fitSSM(inits = c(log(var(Nile)),log(var(Nile))), model = modelNile,
+  method = "BFGS")$model
>
> #if (interactive()) {
>   plot(modelNile)
Error in if (ncol(x) == 1) { : argument is of length zero
Calls: plot -> plot.SSModel -> acf2
Execution halted
 .
.