R: Summary method for Kernel-based Regularized Least Squares...
summary.krls
R Documentation
Summary method for Kernel-based Regularized Least Squares (KRLS) Model Fits
Description
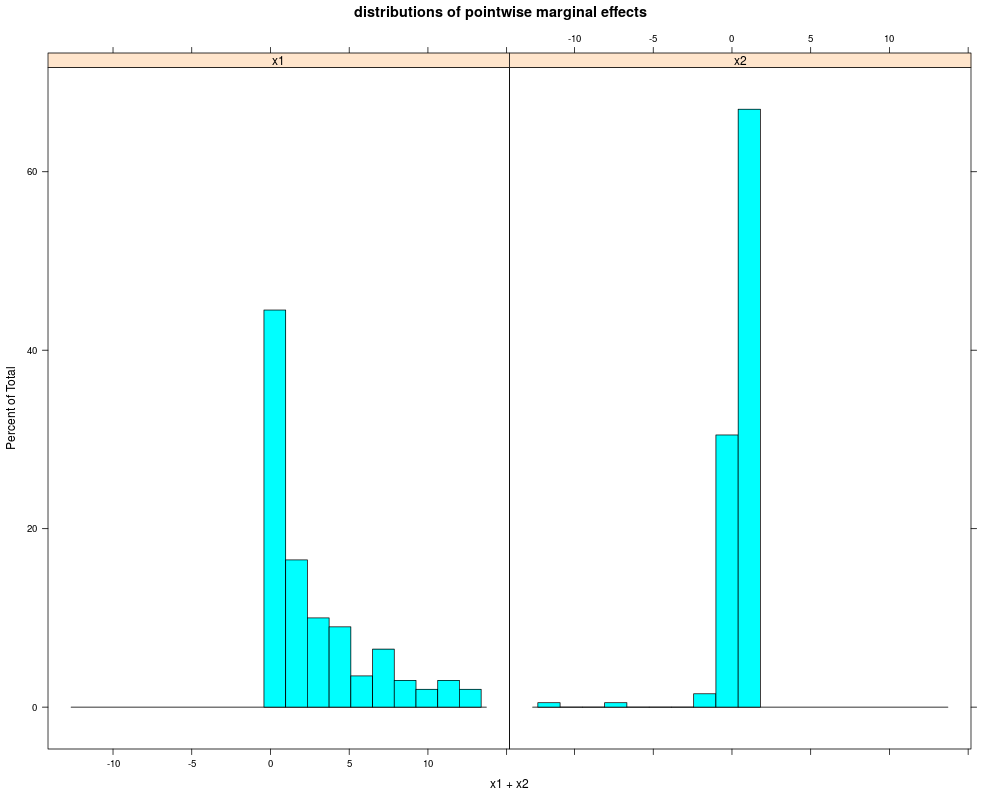
Summarizes average partial derivatives (i.e. marginal effects) and the distribution of the partial derivatives for each predictor. For binary predictors, the marginal effects are the first differences if krls(,derivatives=TRUE,binary=TRUE) was specified.
Usage
 ## S3 method for class 'krls'
summary(object, probs=c(.25,.5,.75),...)
Arguments
object
Fitted krls model, i.e. an object of class krls
probs
numeric vector with numbers between 0 and 1 that specify the quantiles of the pointwise marginal effects for the summary (see the quantile function for details).
...
additional arguments to be passed to lower level functions
Details
Notice that the partial derivatives can only be summarized if the krls object was computed with krls(,derivatives=TRUE).
Value
coefficients
matrix with average partial derivates and or first differences (point estimates, standart errors, t-values, p-values).
qcoefficients
matrix with 1st, 2nd, and 3rd quatriles of distribution of pointwise marinal effects.
Author(s)
Jens Hainmueller (Stanford) and Chad Hazlett (MIT)
See Also
krls
Examples
# non-linear example
# set up data
N <- 200
x1 <- rnorm(N)
x2 <- rbinom(N,size=1,prob=.2)
y <- x1^3 + .5*x2 + rnorm(N,0,.15)
X <- cbind(x1,x2)
# fit model
krlsout <- krls(X=X,y=y)
# summarize marginal effects and contribution of each variable
summary(krlsout)
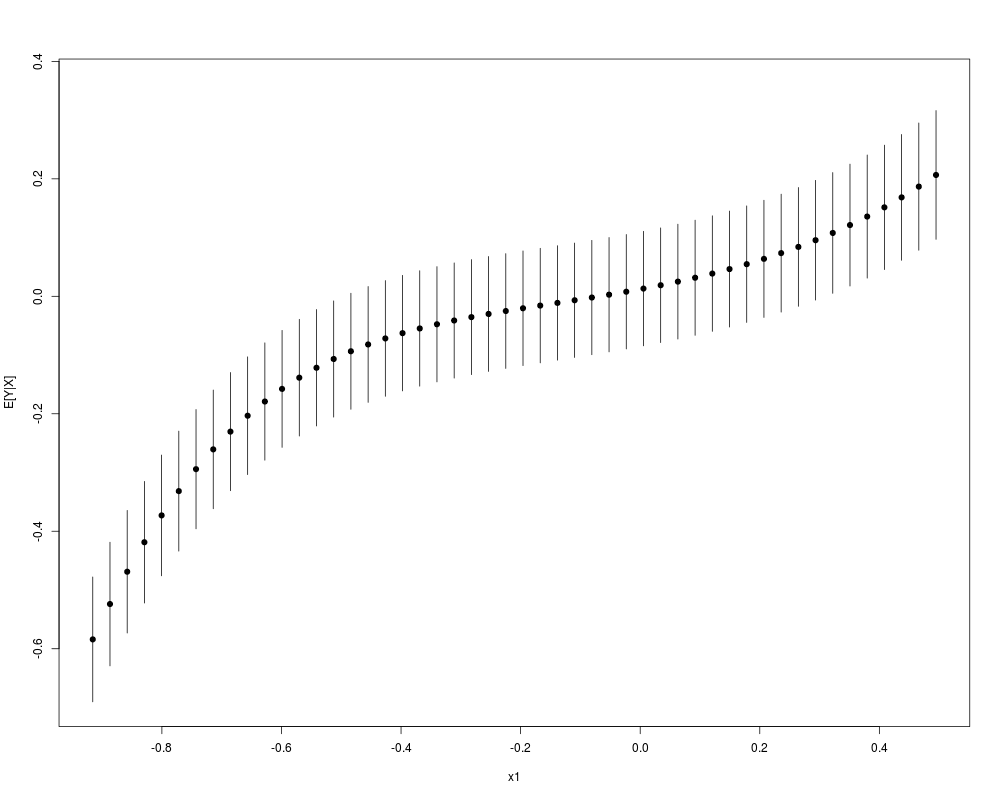
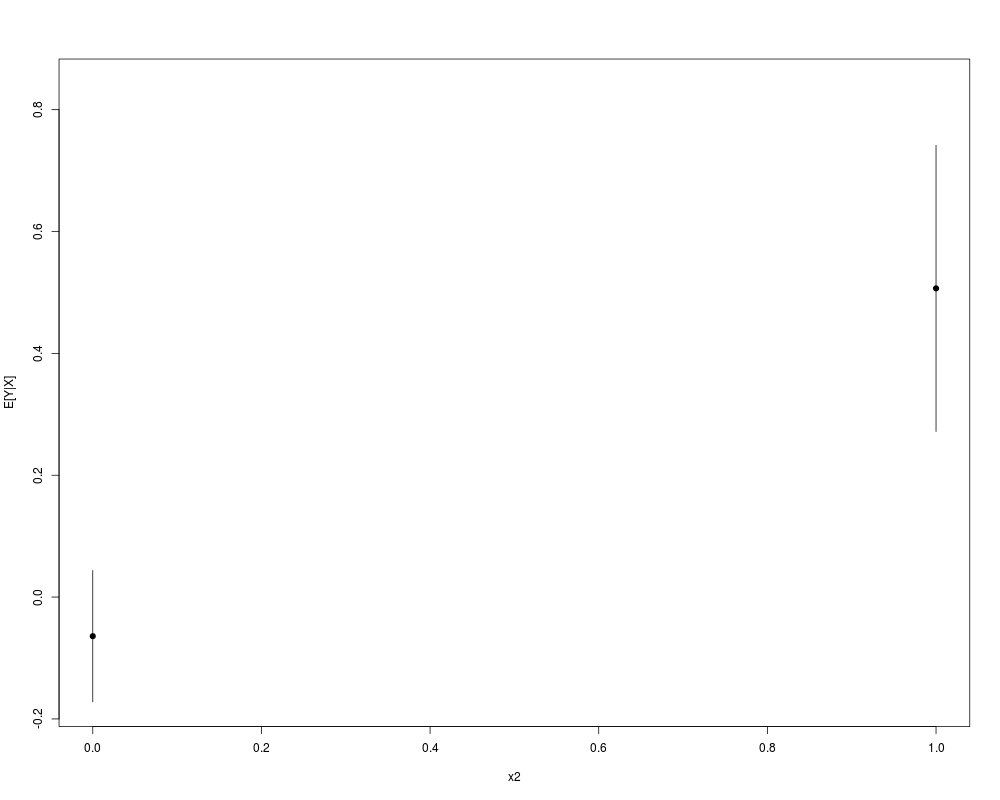
# plot marginal effects and conditional expectation plots
plot(krlsout)
Results
R version 3.3.1 (2016-06-21) -- "Bug in Your Hair"
Copyright (C) 2016 The R Foundation for Statistical Computing
Platform: x86_64-pc-linux-gnu (64-bit)

R is free software and comes with ABSOLUTELY NO WARRANTY.
You are welcome to redistribute it under certain conditions.
Type 'license()' or 'licence()' for distribution details.

R is a collaborative project with many contributors.
Type 'contributors()' for more information and
'citation()' on how to cite R or R packages in publications.

Type 'demo()' for some demos, 'help()' for on-line help, or
'help.start()' for an HTML browser interface to help.
Type 'q()' to quit R.

> library(KRLS)
## KRLS Package for Kernel-based Regularized Least Squares.

## See Hainmueller and Hazlett (2014) for details.

> png(filename="/home/ddbj/snapshot/RGM3/R_CC/result/KRLS/summary.krls.Rd_%03d_medium.png", width=480, height=480)
> ### Name: summary.krls
> ### Title: Summary method for Kernel-based Regularized Least Squares (KRLS)
> ###   Model Fits
> ### Aliases: summary.krls
>
> ### ** Examples
>
> # non-linear example
> # set up data
> N <- 200
> x1 <- rnorm(N)
> x2 <- rbinom(N,size=1,prob=.2)
> y <- x1^3 + .5*x2 + rnorm(N,0,.15)
> X <- cbind(x1,x2)
>
> # fit model
> krlsout <- krls(X=X,y=y)

 Average Marginal Effects:

       x1        x2
2.6861258 0.2928719

 Quartiles of Marginal Effects:

           x1        x2
25% 0.3696261 0.3525954
50% 1.2749089 0.4603667
75% 3.9933838 0.5552597
> # summarize marginal effects and contribution of each variable
> summary(krlsout)
* *********************** *
Model Summary:

R2: 0.9918055

Average Marginal Effects:
          Est Std. Error    t value      Pr(>|t|)
x1  2.6861258 0.02516599 106.736335 6.025081e-177
x2* 0.2928719 0.08486227   3.451144  6.822874e-04

(*) average dy/dx is for discrete change of dummy variable from min to max (i.e. usually 0 to 1))


Quartiles of Marginal Effects:
          25%       50%       75%
x1  0.3696261 1.2749089 3.9933838
x2* 0.3525954 0.4603667 0.5552597

(*) quantiles of dy/dx is for discrete change of dummy variable from min to max (i.e. usually 0 to 1))

> # plot marginal effects and conditional expectation plots
> plot(krlsout)
Loading required package: lattice
>
>
>
>
>
>
> dev.off()
null device
          1
>
 .
.