Supported by Dr. Osamu Ogasawara and  . . |
|
Last data update: 2014.03.03 |
The Log Uniform DistributionDescriptionDensity, distribution function, quantile function and random generation for
the log uniform distribution in the interval from Usagedlunif(x, min, max, base = exp(1)) plunif(q, min, max, base = exp(1)) qlunif(p, min, max, base = exp(1)) rlunif(n, min, max, base = exp(1)) Arguments
DetailsA log uniform (or loguniform or log-uniform) random variable has a uniform distribution when log-transformed. Value
NoteParameters Author(s)Steve Wang scwang@swarthmore.edu See Also
Examples
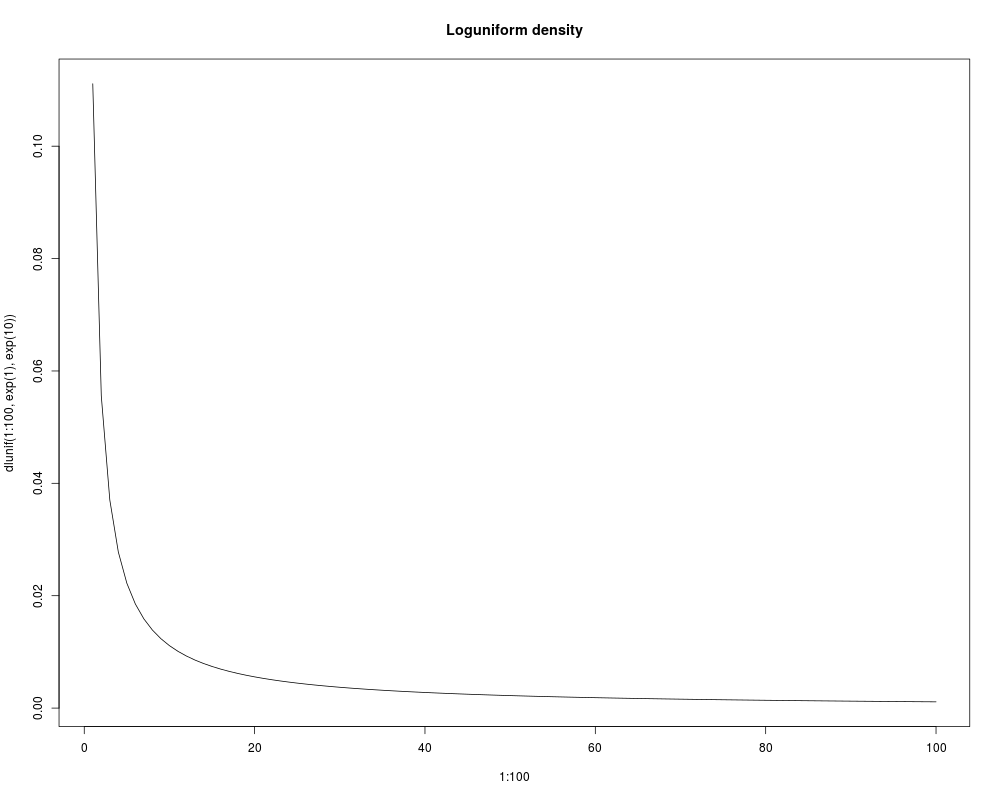
plot(1:100, dlunif(1:100, exp(1), exp(10)), type="l", main="Loguniform density")
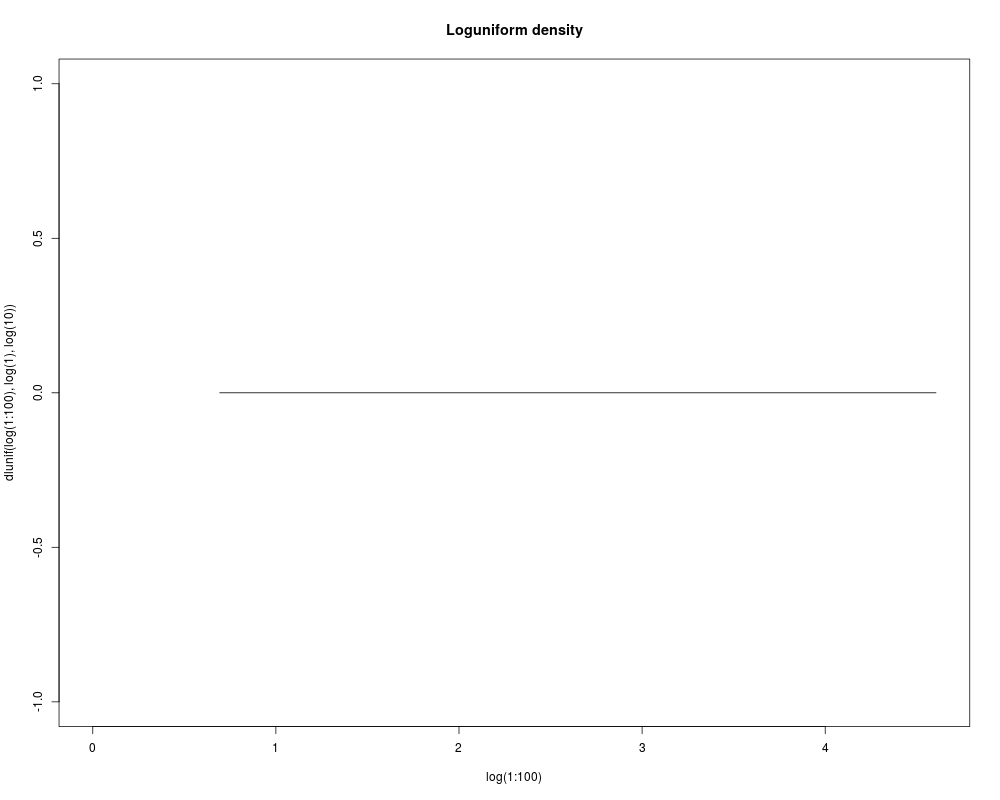
plot(log(1:100), dlunif(log(1:100), log(1), log(10)), type="l",
main="Loguniform density")
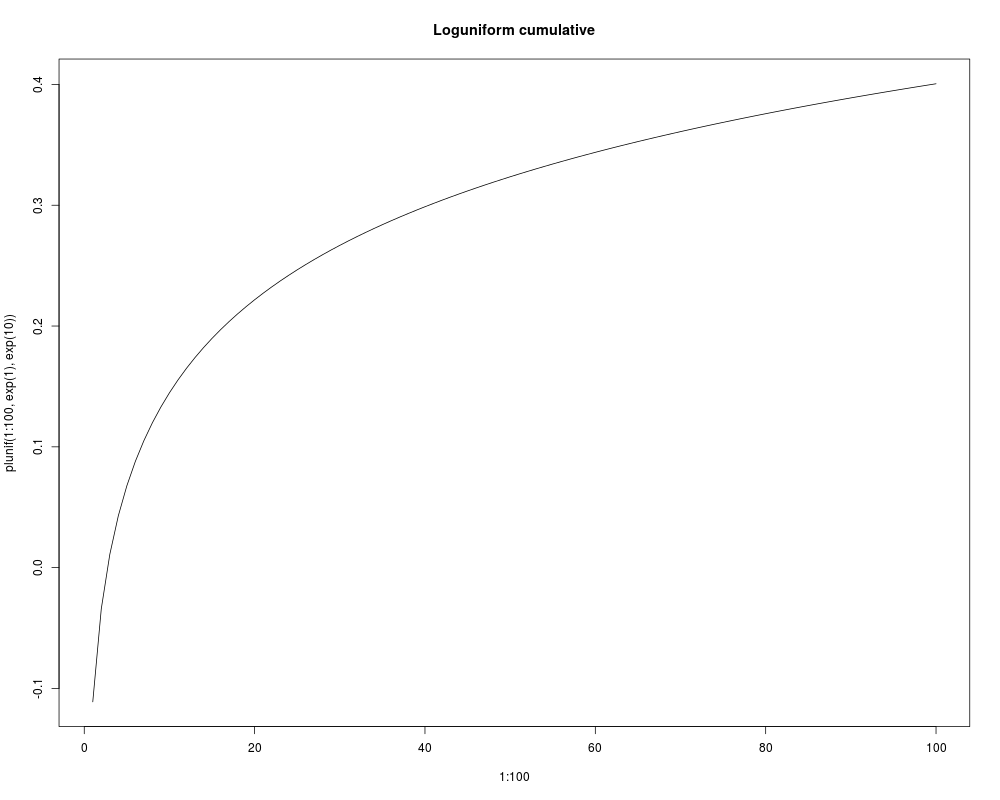
plot(1:100, plunif(1:100, exp(1), exp(10)), type="l", main="Loguniform cumulative")
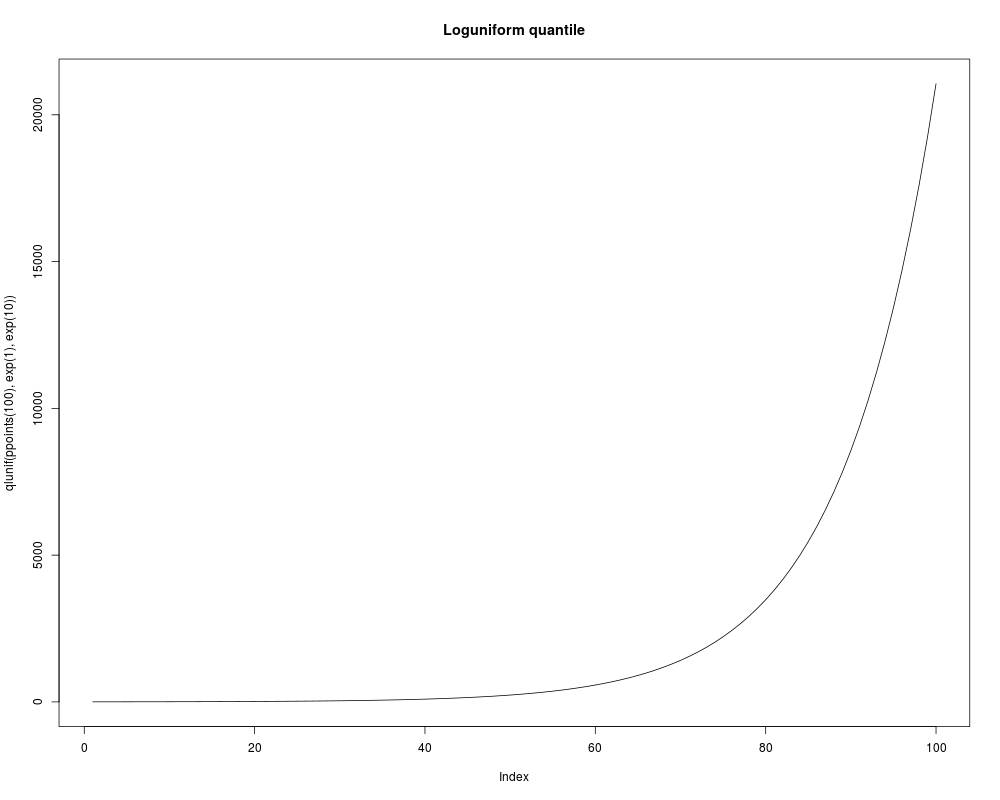
plot(qlunif(ppoints(100), exp(1), exp(10)), type="l", main="Loguniform quantile")
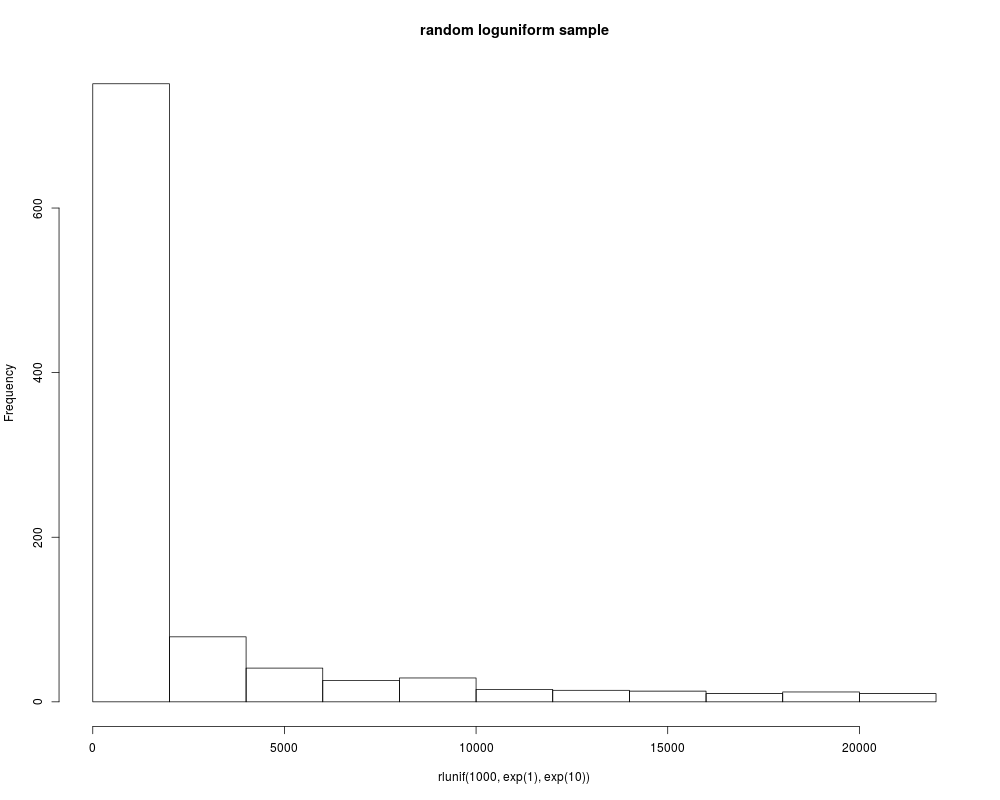
hist(rlunif(1000, exp(1), exp(10)), main="random loguniform sample")
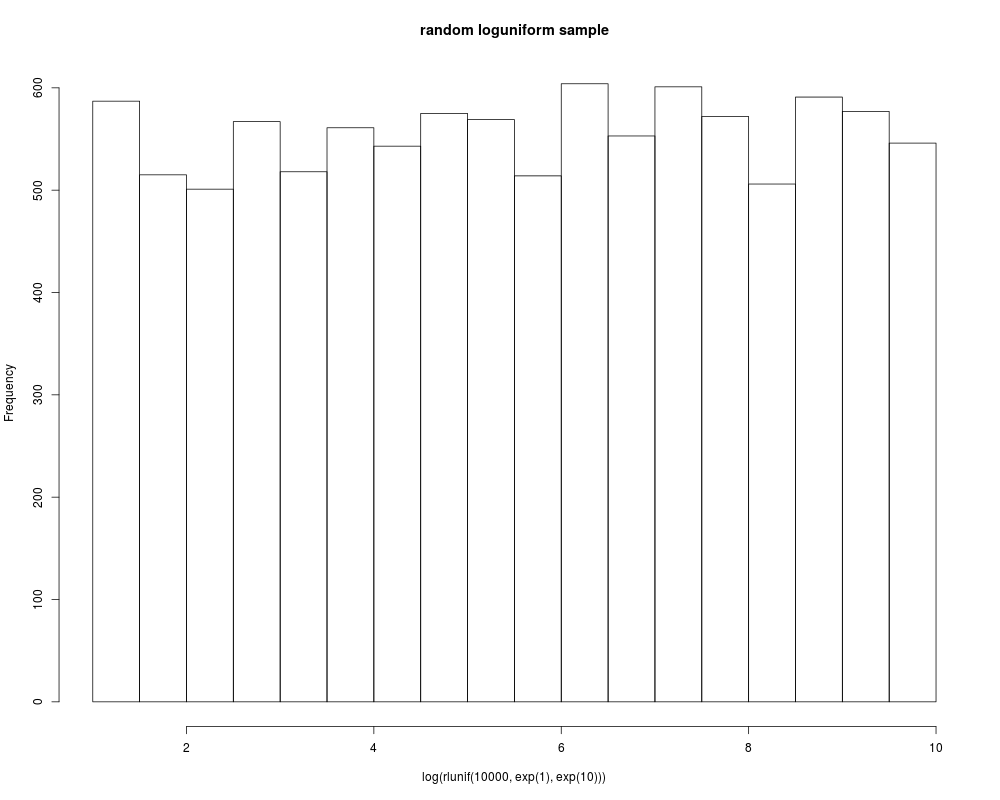
hist(log(rlunif(10000, exp(1), exp(10))), main="random loguniform sample")
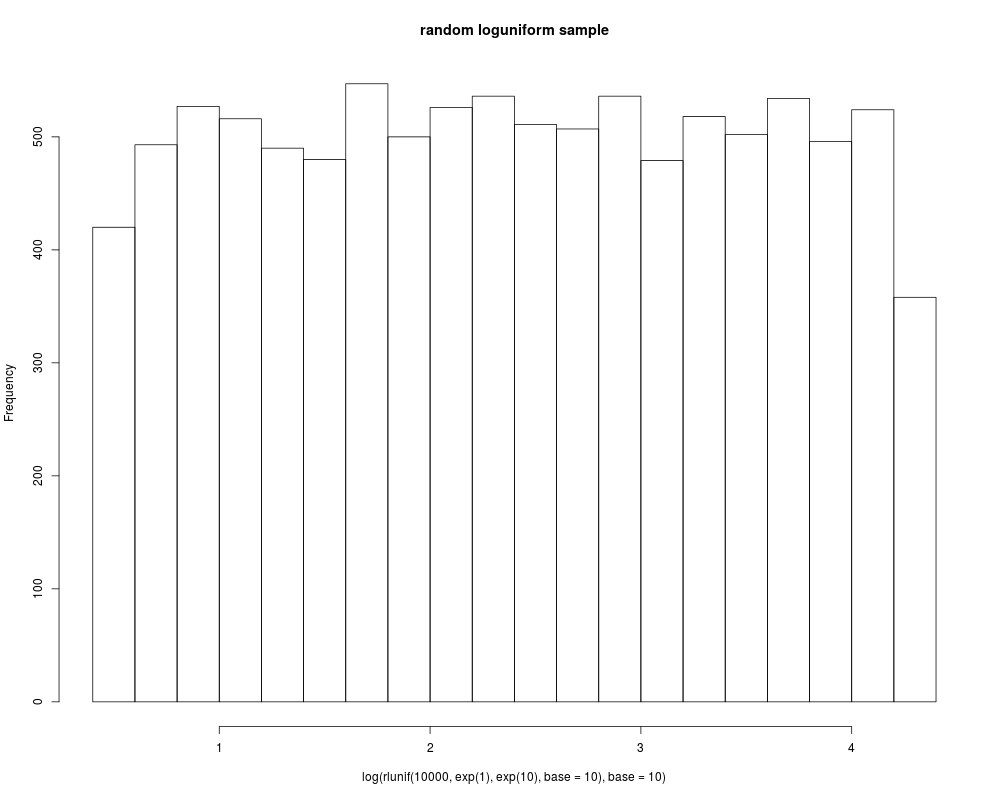
hist(log(rlunif(10000, exp(1), exp(10), base=10), base=10), main="random loguniform sample")
Results
R version 3.3.1 (2016-06-21) -- "Bug in Your Hair"
Copyright (C) 2016 The R Foundation for Statistical Computing
Platform: x86_64-pc-linux-gnu (64-bit)

R is free software and comes with ABSOLUTELY NO WARRANTY.
You are welcome to redistribute it under certain conditions.
Type 'license()' or 'licence()' for distribution details.

R is a collaborative project with many contributors.
Type 'contributors()' for more information and
'citation()' on how to cite R or R packages in publications.

Type 'demo()' for some demos, 'help()' for on-line help, or
'help.start()' for an HTML browser interface to help.
Type 'q()' to quit R.

> library(KScorrect)
> png(filename="/home/ddbj/snapshot/RGM3/R_CC/result/KScorrect/dlunif.Rd_%03d_medium.png", width=480, height=480)
> ### Name: dlunif
> ### Title: The Log Uniform Distribution
> ### Aliases: dlunif plunif qlunif rlunif
>
> ### ** Examples
>
> plot(1:100, dlunif(1:100, exp(1), exp(10)), type="l", main="Loguniform density")
> plot(log(1:100), dlunif(log(1:100), log(1), log(10)), type="l",
+      main="Loguniform density")
>
> plot(1:100, plunif(1:100, exp(1), exp(10)), type="l", main="Loguniform cumulative")
> plot(qlunif(ppoints(100), exp(1), exp(10)), type="l", main="Loguniform quantile")
>
> hist(rlunif(1000, exp(1), exp(10)), main="random loguniform sample")
> hist(log(rlunif(10000, exp(1), exp(10))), main="random loguniform sample")
> hist(log(rlunif(10000, exp(1), exp(10), base=10), base=10), main="random loguniform sample")
>
>
>
>
>
>
> dev.off()
null device
          1
>
|