Supported by Dr. Osamu Ogasawara and  . . |
|
Last data update: 2014.03.03 |
The Normal Mixture DistributionDescriptionDensity, distribution function, quantile function, and random generation for
a univariate (one-dimensional) distribution composed of a mixture of normal
distributions with means equal to Usagedmixnorm(x, mean, sd, pro) pmixnorm(q, mean, sd, pro) qmixnorm(p, mean, sd, pro, expand = 1) rmixnorm(n, mean, sd, pro) Arguments
DetailsThese functions use, modify, and wrap around those from the
Unlike The number of mixture components (argument Analytical solutions are not available to calculate a quantile function for
all combinations of mixture parameters. Value
Author(s)Phil Novack-Gottshall pnovack-gottshall@ben.edu and Steve Wang scwang@swarthmore.edu, based on functions written by Luca Scrucca. See Also
Examples
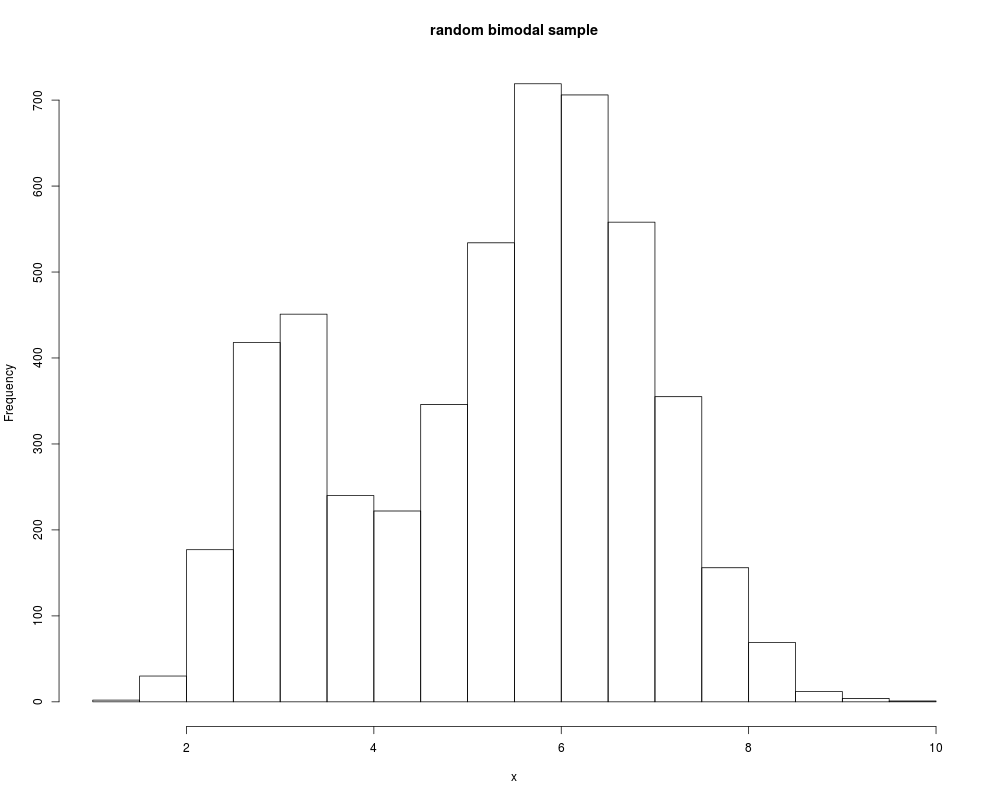
# Mixture of two normal distributions
mean <- c(3, 6)
pro <- c(.25, .75)
sd <- c(.5, 1)
x <- rmixnorm(n=5000, mean=mean, pro=pro, sd=sd)
hist(x, n=20, main="random bimodal sample")
## Not run:
# Requires functions from the 'mclust' package
require(mclust)
# Confirm 'rmixnorm' above produced specified model
mod <- mclust::Mclust(x)
mod # Best model (correctly) has two-components with unequal variances
mod$parameters # and approximately same parameters as specified above
sd^2 # Note reports var (sigma-squared) instead of sd used above
## End(Not run)
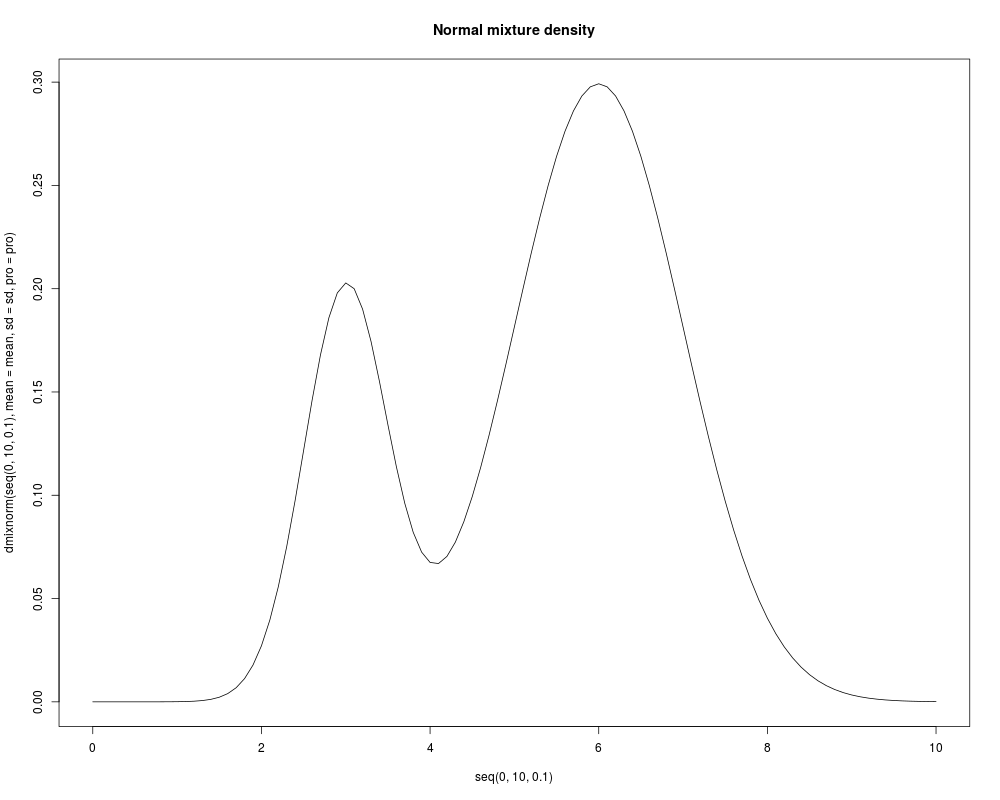
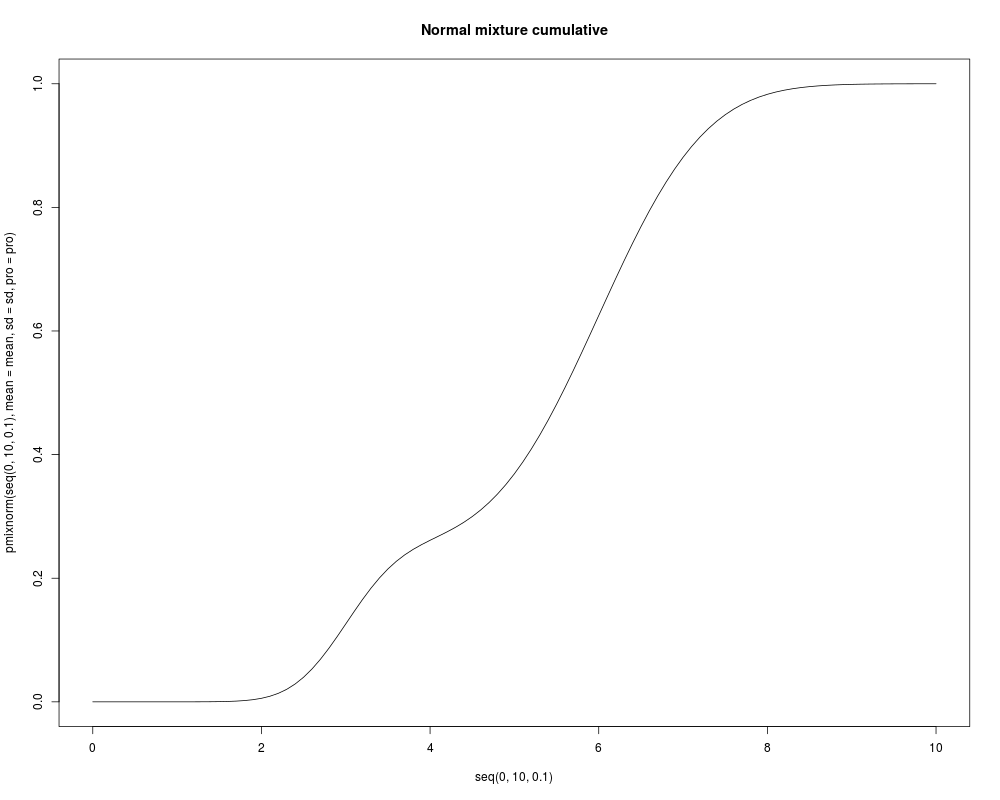
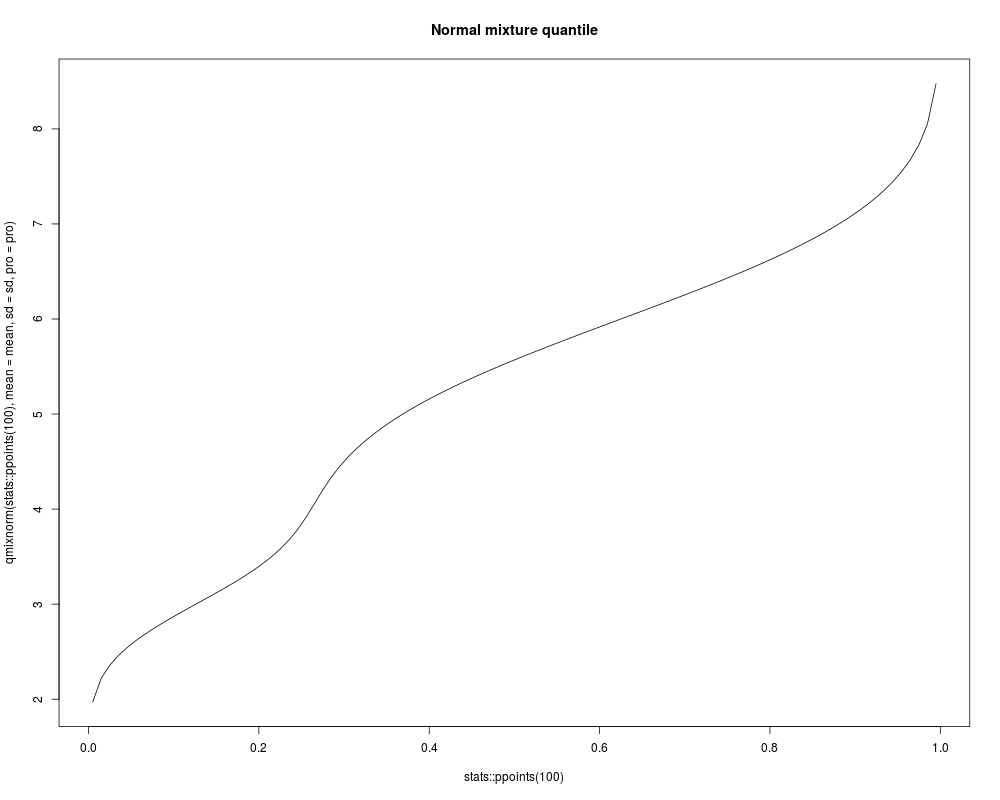
# Density, distribution, and quantile functions
plot(seq(0, 10, .1), dmixnorm(seq(0, 10, .1), mean=mean, sd=sd, pro=pro),
type="l", main="Normal mixture density")
plot(seq(0, 10, .1), pmixnorm(seq(0, 10, .1), mean=mean, sd=sd, pro=pro),
type="l", main="Normal mixture cumulative")
plot(stats::ppoints(100), qmixnorm(stats::ppoints(100), mean=mean, sd=sd, pro=pro),
type="l", main="Normal mixture quantile")
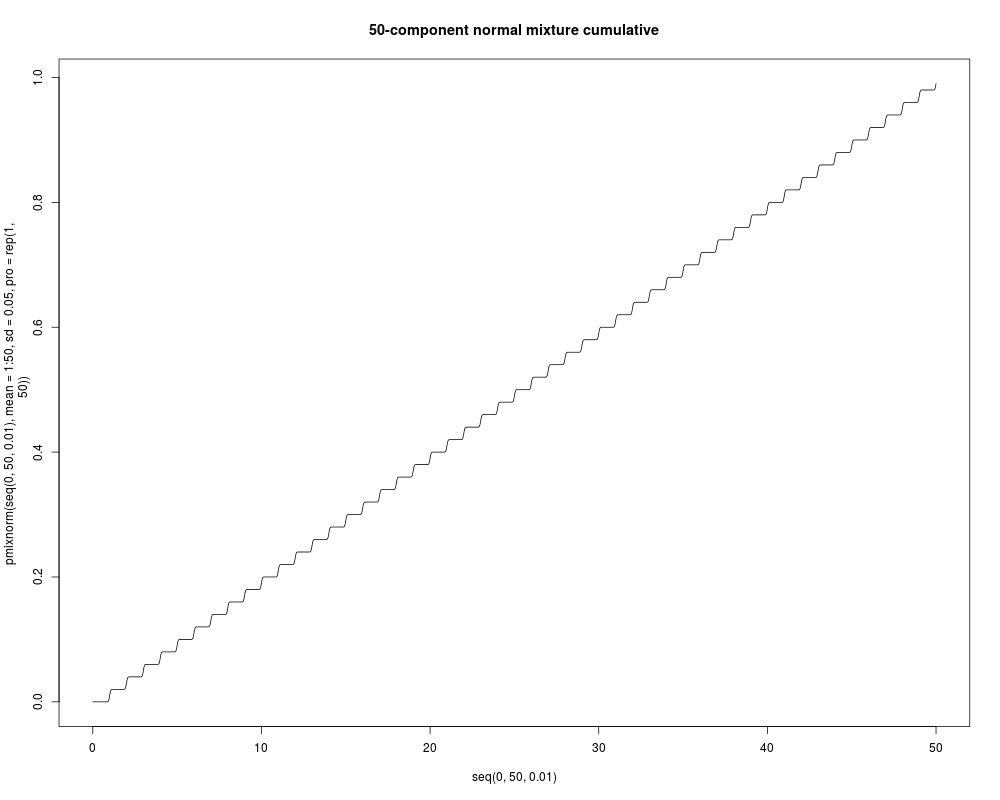
# Any number of mixture components are allowed
plot(seq(0, 50, .01), pmixnorm(seq(0, 50, .01), mean=1:50, sd=.05, pro=rep(1, 50)),
type="l", main="50-component normal mixture cumulative")
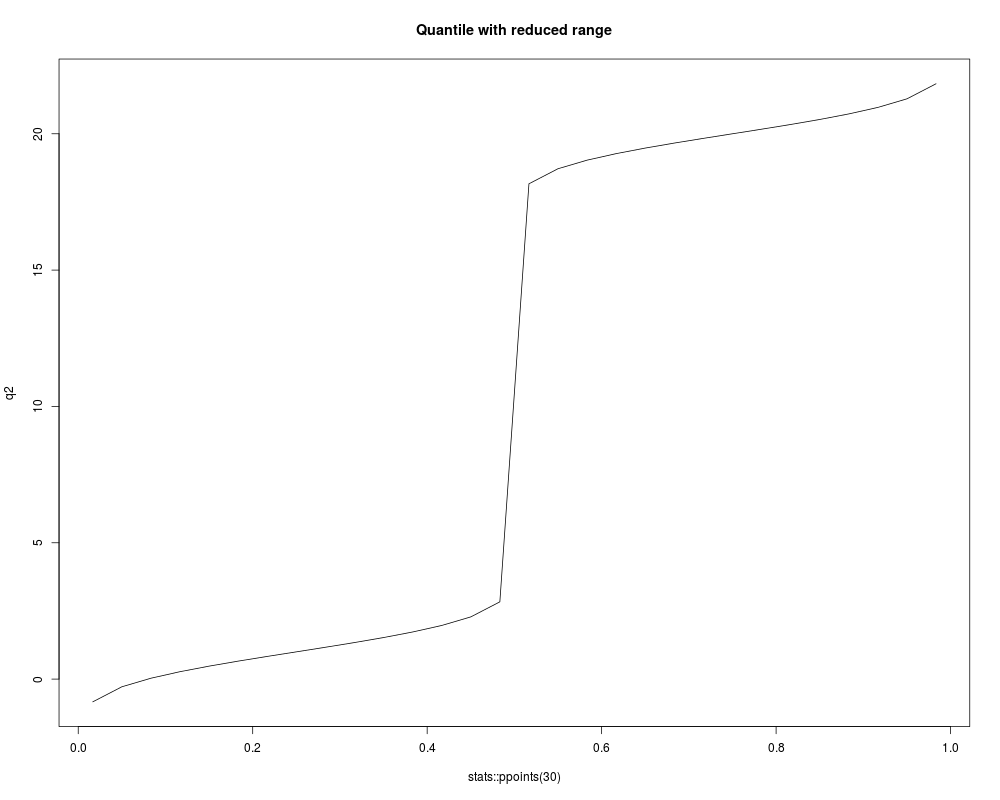
# 'expand' can be specified to prevent non-calculable quantiles:
q1 <- qmixnorm(stats::ppoints(30), mean=c(1, 20), sd=c(1, 1), pro=c(1, 1))
q1 # Calls a warning because of NaNs
# Reduce 'expand'. (Values < 0.8 allow correct approximation)
q2 <- qmixnorm(stats::ppoints(30), mean=c(1, 20), sd=c(1, 1), pro=c(1, 1), expand=.5)
plot(stats::ppoints(30), q2, type="l", main="Quantile with reduced range")
## Not run:
# Requires functions from the 'mclust' package
# Confirmation that qmixnorm approximates correct solution
# (single component 'mixture' should mimic qnorm):
x <- rmixnorm(n=5000, mean=0, pro=1, sd=1)
mpar <- mclust::Mclust(x)$param
approx <- qmixnorm(p=ppoints(100), mean=mpar$mean, pro=mpar$pro,
sd=sqrt(mpar$variance$sigmasq))
known <- qnorm(p=ppoints(100), mean=mpar$mean, sd=sqrt(mpar$variance$sigmasq))
cor(approx, known) # Approximately the same
plot(approx, main="Quantiles for (unimodal) normal")
lines(known)
legend("topleft", legend=c("known", "approximation"), pch=c(NA,1),
lty=c(1, NA), bty="n")
## End(Not run)
Results
R version 3.3.1 (2016-06-21) -- "Bug in Your Hair"
Copyright (C) 2016 The R Foundation for Statistical Computing
Platform: x86_64-pc-linux-gnu (64-bit)

R is free software and comes with ABSOLUTELY NO WARRANTY.
You are welcome to redistribute it under certain conditions.
Type 'license()' or 'licence()' for distribution details.

R is a collaborative project with many contributors.
Type 'contributors()' for more information and
'citation()' on how to cite R or R packages in publications.

Type 'demo()' for some demos, 'help()' for on-line help, or
'help.start()' for an HTML browser interface to help.
Type 'q()' to quit R.

> library(KScorrect)
> png(filename="/home/ddbj/snapshot/RGM3/R_CC/result/KScorrect/dmixnorm.Rd_%03d_medium.png", width=480, height=480)
> ### Name: dmixnorm
> ### Title: The Normal Mixture Distribution
> ### Aliases: dmixnorm pmixnorm qmixnorm rmixnorm
>
> ### ** Examples
>
> # Mixture of two normal distributions
> mean <- c(3, 6)
> pro <- c(.25, .75)
> sd <- c(.5, 1)
> x <- rmixnorm(n=5000, mean=mean, pro=pro, sd=sd)
> hist(x, n=20, main="random bimodal sample")
>
> ## Not run:
> ##D # Requires functions from the 'mclust' package
> ##D require(mclust)
> ##D # Confirm 'rmixnorm' above produced specified model
> ##D mod <- mclust::Mclust(x)
> ##D mod             # Best model (correctly) has two-components with unequal variances
> ##D mod$parameters	# and approximately same parameters as specified above
> ##D sd^2            # Note reports var (sigma-squared) instead of sd used above
> ## End(Not run)
>
> # Density, distribution, and quantile functions
> plot(seq(0, 10, .1), dmixnorm(seq(0, 10, .1), mean=mean, sd=sd, pro=pro),
+      type="l", main="Normal mixture density")
> plot(seq(0, 10, .1), pmixnorm(seq(0, 10, .1), mean=mean, sd=sd, pro=pro),
+      type="l", main="Normal mixture cumulative")
> plot(stats::ppoints(100), qmixnorm(stats::ppoints(100), mean=mean, sd=sd, pro=pro),
+      type="l", main="Normal mixture quantile")
>
> # Any number of mixture components are allowed
> plot(seq(0, 50, .01), pmixnorm(seq(0, 50, .01), mean=1:50, sd=.05, pro=rep(1, 50)),
+      type="l", main="50-component normal mixture cumulative")
Warning message:
In pmixnorm(seq(0, 50, 0.01), mean = 1:50, sd = 0.05, pro = rep(1,  :
  'equal variance model' implemented. If want 'variable-variance model', specify remaining 'sd's.
>
> # 'expand' can be specified to prevent non-calculable quantiles:
> q1 <- qmixnorm(stats::ppoints(30), mean=c(1, 20), sd=c(1, 1), pro=c(1, 1))
Warning message:
In qmixnorm(stats::ppoints(30), mean = c(1, 20), sd = c(1, 1), pro = c(1,  :
  Some quantile values could not be calculated. If all 'p's are within [0,1], try reducing the value of 'expand' and try again.
> q1 # Calls a warning because of NaNs
 [1] NaN NaN NaN NaN NaN NaN NaN NaN NaN NaN NaN NaN NaN NaN NaN NaN NaN NaN NaN
[20] NaN NaN NaN NaN NaN NaN NaN NaN NaN NaN NaN
> # Reduce 'expand'. (Values < 0.8 allow correct approximation)
> q2 <- qmixnorm(stats::ppoints(30), mean=c(1, 20), sd=c(1, 1), pro=c(1, 1), expand=.5)
> plot(stats::ppoints(30), q2, type="l", main="Quantile with reduced range")
>
> ## Not run:
> ##D # Requires functions from the 'mclust' package
> ##D # Confirmation that qmixnorm approximates correct solution
> ##D #   (single component 'mixture' should mimic qnorm):
> ##D x <- rmixnorm(n=5000, mean=0, pro=1, sd=1)
> ##D mpar <- mclust::Mclust(x)$param
> ##D approx <- qmixnorm(p=ppoints(100), mean=mpar$mean, pro=mpar$pro,
> ##D      sd=sqrt(mpar$variance$sigmasq))
> ##D known <- qnorm(p=ppoints(100), mean=mpar$mean, sd=sqrt(mpar$variance$sigmasq))
> ##D cor(approx, known)  # Approximately the same
> ##D plot(approx, main="Quantiles for (unimodal) normal")
> ##D lines(known)
> ##D legend("topleft", legend=c("known", "approximation"), pch=c(NA,1),
> ##D      lty=c(1, NA), bty="n")
> ## End(Not run)
>
>
>
>
>
> dev.off()
null device
          1
>
|