R version 3.3.1 (2016-06-21) -- "Bug in Your Hair"
Copyright (C) 2016 The R Foundation for Statistical Computing
Platform: x86_64-pc-linux-gnu (64-bit)
R is free software and comes with ABSOLUTELY NO WARRANTY.
You are welcome to redistribute it under certain conditions.
Type 'license()' or 'licence()' for distribution details.
R is a collaborative project with many contributors.
Type 'contributors()' for more information and
'citation()' on how to cite R or R packages in publications.
Type 'demo()' for some demos, 'help()' for on-line help, or
'help.start()' for an HTML browser interface to help.
Type 'q()' to quit R.
> library(Kernelheaping)
Loading required package: MASS
Loading required package: ks
Loading required package: KernSmooth
KernSmooth 2.23 loaded
Copyright M. P. Wand 1997-2009
Loading required package: misc3d
Loading required package: mvtnorm
Loading required package: rgl
Loading required package: sparr
Loading required package: spatstat
Loading required package: nlme
Loading required package: rpart
spatstat 1.45-2 (nickname: 'Caretaker Mode')
For an introduction to spatstat, type 'beginner'
Attaching package: 'spatstat'
The following object is masked from 'package:MASS':
area
Welcome to 'sparr': SPAtial Relative Risk (v0.3-8)
T.M. Davies, M.L. Hazelton & J.C. Marshall
-type 'help("sparr")' for details
-type 'citation("sparr")' for how to cite use of this package
> png(filename="/home/ddbj/snapshot/RGM3/R_CC/result/Kernelheaping/dclass.Rd_%03d_medium.png", width=480, height=480)
> ### Name: dclass
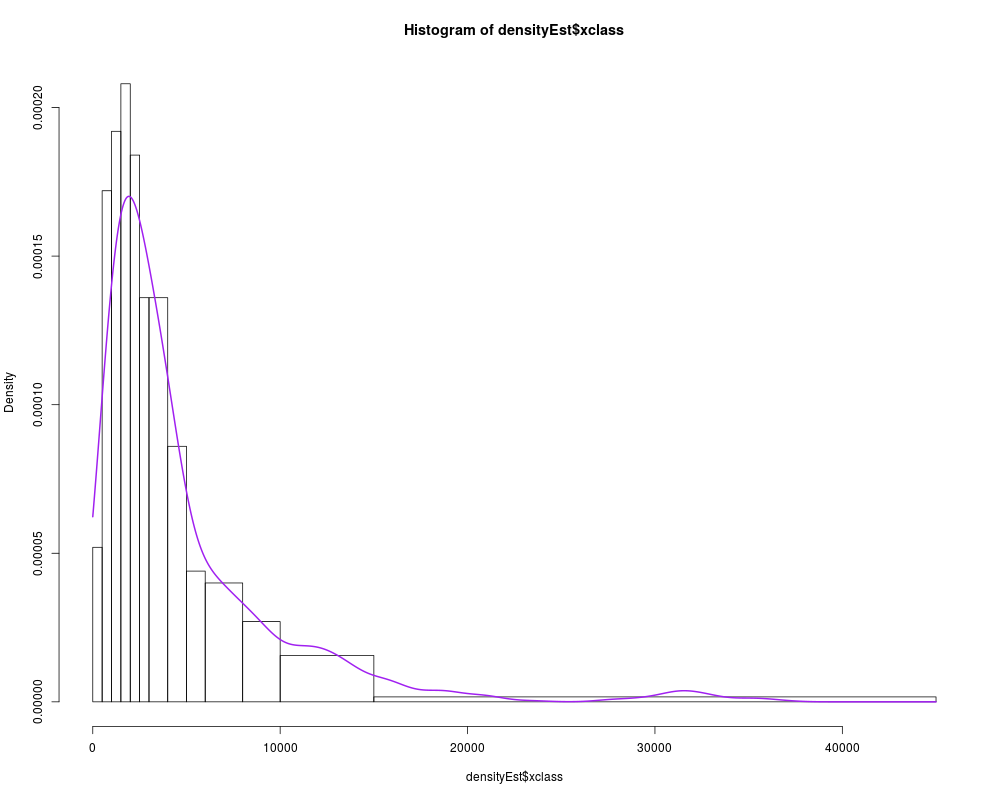
> ### Title: Kernel density estimation for classified data
> ### Aliases: dclass
>
> ### ** Examples
>
> x=rlnorm(500, meanlog = 8, sdlog = 1)
> classes <- c(0,500,1000,1500,2000,2500,3000,4000,5000,6000,8000,10000,15000,Inf)
> xclass <- cut(x,breaks=classes)
> densityEst <- dclass(xclass=xclass, classes=classes, burnin=2, samples=5, evalpoints=1000)
[1] "Iteration: 1 of 7"
[1] "Iteration: 2 of 7"
[1] "Iteration: 3 of 7"
[1] "Iteration: 4 of 7"
[1] "Iteration: 5 of 7"
[1] "Iteration: 6 of 7"
[1] "Iteration: 7 of 7"
> hist(densityEst$xclass,breaks=densityEst$classes)
> lines(densityEst$Mestimates~densityEst$gridx,col="purple",lwd=2)
>
>
>
>
>
> dev.off()
null device
1
>
 .
.