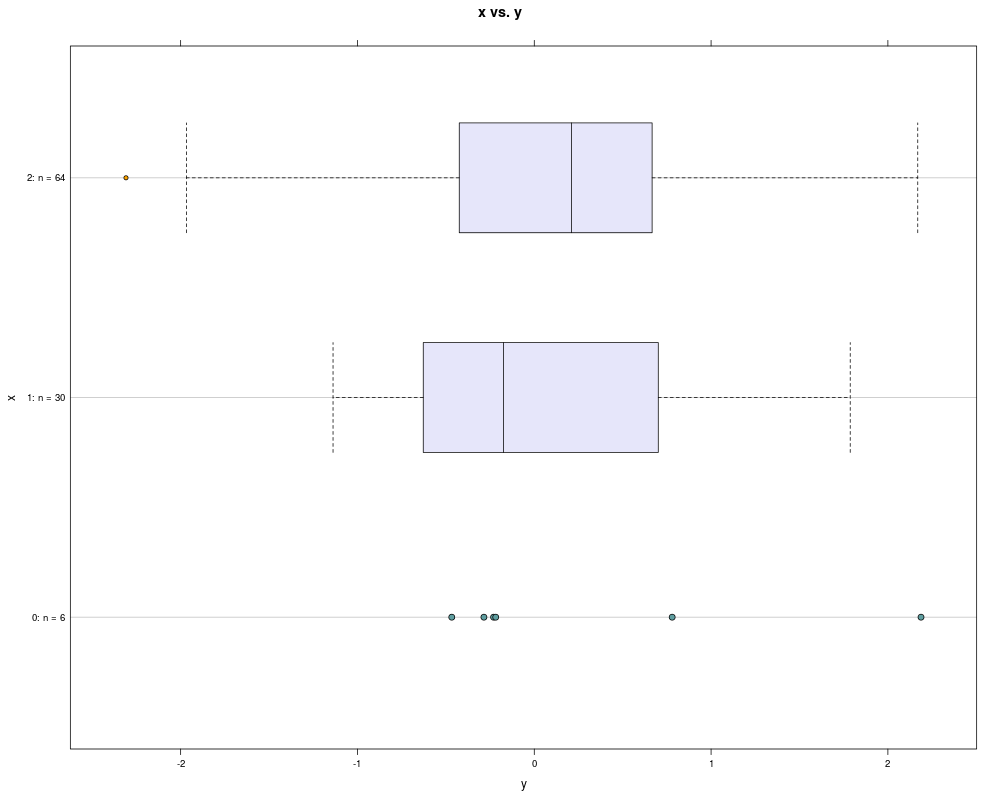
This generates a custom lattice boxplot; we super-impose
actual plot points for groups with a small number of
points, and also restrict plotting of the boxplot for these
as well (since they are really rather mis-representative of
the distribution when there are so few points.) The
downside is that functionality is not implemented for
multi-panel plots.
Usage
bwplot2(form, data = NULL, xlab = NULL, ylab = NULL, main = NULL,
  n = 10, ...)
Arguments
form
a formula object as expected by
lattice's xyplot.
data
see xyplot.
xlab
see xyplot.
ylab
see xyplot.
main
see xyplot.
n
number of points necessary for a boxplot to be
drawn.
...
additional arguments passed to xyplot
call.
Details
Axis labels are inferred from the form object passed
in when possible.
Examples
set.seed(123)
dat <- data.frame( y=rnorm(100), x=factor( rbinom(100,size=2,p=0.8) ) )
bwplot2( x ~ y , dat)
Results
R version 3.3.1 (2016-06-21) -- "Bug in Your Hair"
Copyright (C) 2016 The R Foundation for Statistical Computing
Platform: x86_64-pc-linux-gnu (64-bit)

R is free software and comes with ABSOLUTELY NO WARRANTY.
You are welcome to redistribute it under certain conditions.
Type 'license()' or 'licence()' for distribution details.

R is a collaborative project with many contributors.
Type 'contributors()' for more information and
'citation()' on how to cite R or R packages in publications.

Type 'demo()' for some demos, 'help()' for on-line help, or
'help.start()' for an HTML browser interface to help.
Type 'q()' to quit R.

> library(Kmisc)
> png(filename="/home/ddbj/snapshot/RGM3/R_CC/result/Kmisc/bwplot2.Rd_%03d_medium.png", width=480, height=480)
> ### Name: bwplot2
> ### Title: Custom Lattice Boxplot
> ### Aliases: bwplot2
>
> ### ** Examples
>
> set.seed(123)
> dat <- data.frame( y=rnorm(100), x=factor( rbinom(100,size=2,p=0.8) ) )
> bwplot2( x ~ y , dat)
>
>
>
>
>
> dev.off()
null device
          1
>
 .
.