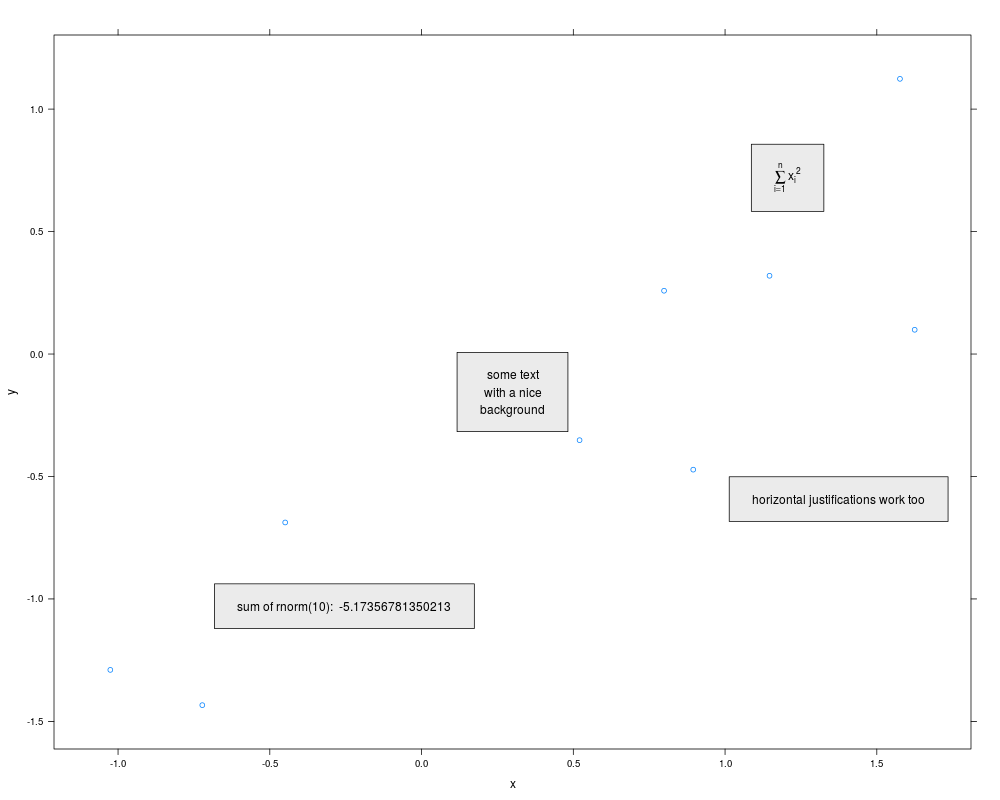
This function produces text as does grid.text, but
also generates a background rectangle through
grid.rect. Helpful for plotting e.g. overlaying
correlation statistics on a plot, where you'd like the
element to stand out a little more.
Usage
grid.text2(label, x = unit(0.5, "npc"), y = unit(0.5, "npc"),
  just = "centre", hjust = NULL, vjust = NULL, check.overlap = FALSE,
  default.units = "npc", name = NULL, gp = gpar(col = "black", fill =
  "grey92", lineend = "butt", linejoin = "round"), draw = TRUE, vp = NULL,
  widthAdj = unit(0.05, "npc"), heightAdj = unit(0.05, "npc"))
Arguments
label
A character or expression
vector. Other objects are coerced by
as.graphicsAnnot.
x
A numeric vector or unit object specifying
x-values.
y
A numeric vector or unit object specifying
y-values.
just
The justification of the text relative to its
(x, y) location. If there are two values, the first value
specifies horizontal justification and the second value
specifies vertical justification. Possible string values
are: "left", "right", "centre",
"center", "bottom", and "top". For
numeric values, 0 means left alignment and 1 means right
alignment.
hjust
A numeric vector specifying horizontal
justification. If specified, overrides the just
setting.
vjust
A numeric vector specifying vertical
justification. If specified, overrides the just
setting.
check.overlap
A logical value to indicate whether
to check for and omit overlapping text.
default.units
A string indicating the default
units to use if x or y are only given as
numeric vectors.
name
A character identifier.
gp
An object of class gpar, typically the
output from a call to the function gpar. This is
basically a list of graphical parameter settings.
draw
A logical value indiciating whether graphics
output should be produced.
vp
A Grid viewport object (or NULL).
widthAdj
A width adjustment parameter, to help
control how much horizontal padding there should be
between the text and the background rectangle.
heightAdj
A height adjustment parameter, to help
control how much vertical padding there should be between
the text and the background rectangle.
See Also
grid.text and grid.rect
Examples
x <- rnorm(10)
y <- rnorm(10)
if (require(lattice)) xyplot( y ~ x,
        panel = function(x, y, ...) {
          panel.xyplot(x, y, ...)
          grid.text2("some text\nwith a nice\nbackground")
          grid.text2( expression( sum(x[i], i==1, n)^2 ), x=0.8, y=0.8 )
          grid.text2( paste("sum of rnorm(10): ", sum(rnorm(10)) ), x=0.2, y=0.2, just="left" )
          grid.text2( "horizontal justifications work too", x=0.95, y=0.35, just="right" )
        })
## will work for multi-panel plots as well
Results
R version 3.3.1 (2016-06-21) -- "Bug in Your Hair"
Copyright (C) 2016 The R Foundation for Statistical Computing
Platform: x86_64-pc-linux-gnu (64-bit)

R is free software and comes with ABSOLUTELY NO WARRANTY.
You are welcome to redistribute it under certain conditions.
Type 'license()' or 'licence()' for distribution details.

R is a collaborative project with many contributors.
Type 'contributors()' for more information and
'citation()' on how to cite R or R packages in publications.

Type 'demo()' for some demos, 'help()' for on-line help, or
'help.start()' for an HTML browser interface to help.
Type 'q()' to quit R.

> library(Kmisc)
> png(filename="/home/ddbj/snapshot/RGM3/R_CC/result/Kmisc/grid.text2.Rd_%03d_medium.png", width=480, height=480)
> ### Name: grid.text2
> ### Title: Grid Text with a Background
> ### Aliases: grid.text2
>
> ### ** Examples
>
> x <- rnorm(10)
> y <- rnorm(10)
> if (require(lattice)) xyplot( y ~ x,
+         panel = function(x, y, ...) {
+           panel.xyplot(x, y, ...)
+           grid.text2("some text\nwith a nice\nbackground")
+           grid.text2( expression( sum(x[i], i==1, n)^2 ), x=0.8, y=0.8 )
+           grid.text2( paste("sum of rnorm(10): ", sum(rnorm(10)) ), x=0.2, y=0.2, just="left" )
+           grid.text2( "horizontal justifications work too", x=0.95, y=0.35, just="right" )
+         })
Loading required package: lattice
> ## will work for multi-panel plots as well
>
>
>
>
>
> dev.off()
null device
          1
>
 .
.