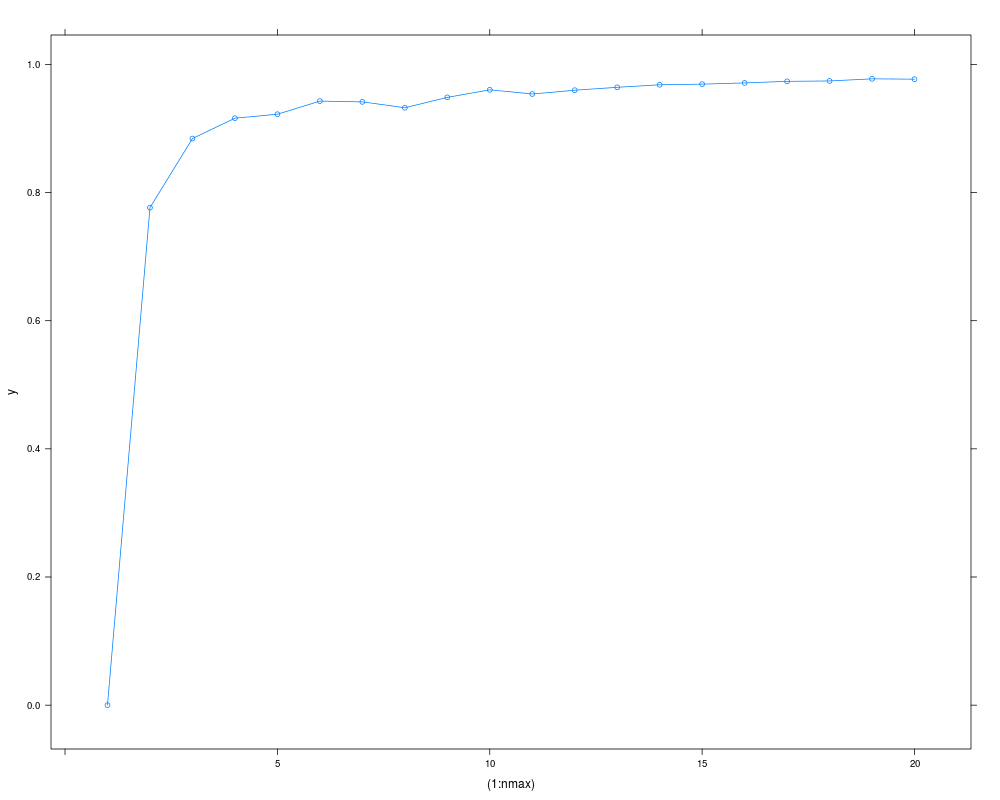
Using kmeans, plot percentage variance explained vs.
number of clusters. Used as a means of picking k.
Usage
kmeans_plot(dat, nmax = 20, ...)
Arguments
dat
numeric matrix of data, or an object that can
be coerced to such a matrix (such as a numeric vector or
a data frame with all numeric columns).
nmax
maximum number of clusters to examine
...
optional arguments passed to xyplot
See Also
kmeans
Examples
data(iris)
kmeans_plot(iris[,1:4])
Results
R version 3.3.1 (2016-06-21) -- "Bug in Your Hair"
Copyright (C) 2016 The R Foundation for Statistical Computing
Platform: x86_64-pc-linux-gnu (64-bit)

R is free software and comes with ABSOLUTELY NO WARRANTY.
You are welcome to redistribute it under certain conditions.
Type 'license()' or 'licence()' for distribution details.

R is a collaborative project with many contributors.
Type 'contributors()' for more information and
'citation()' on how to cite R or R packages in publications.

Type 'demo()' for some demos, 'help()' for on-line help, or
'help.start()' for an HTML browser interface to help.
Type 'q()' to quit R.

> library(Kmisc)
> png(filename="/home/ddbj/snapshot/RGM3/R_CC/result/Kmisc/kmeans_plot.Rd_%03d_medium.png", width=480, height=480)
> ### Name: kmeans_plot
> ### Title: k-means Diagnostic Plot
> ### Aliases: kmeans_plot
>
> ### ** Examples
>
> data(iris)
> kmeans_plot(iris[,1:4])
>
>
>
>
>
> dev.off()
null device
          1
>
 .
.