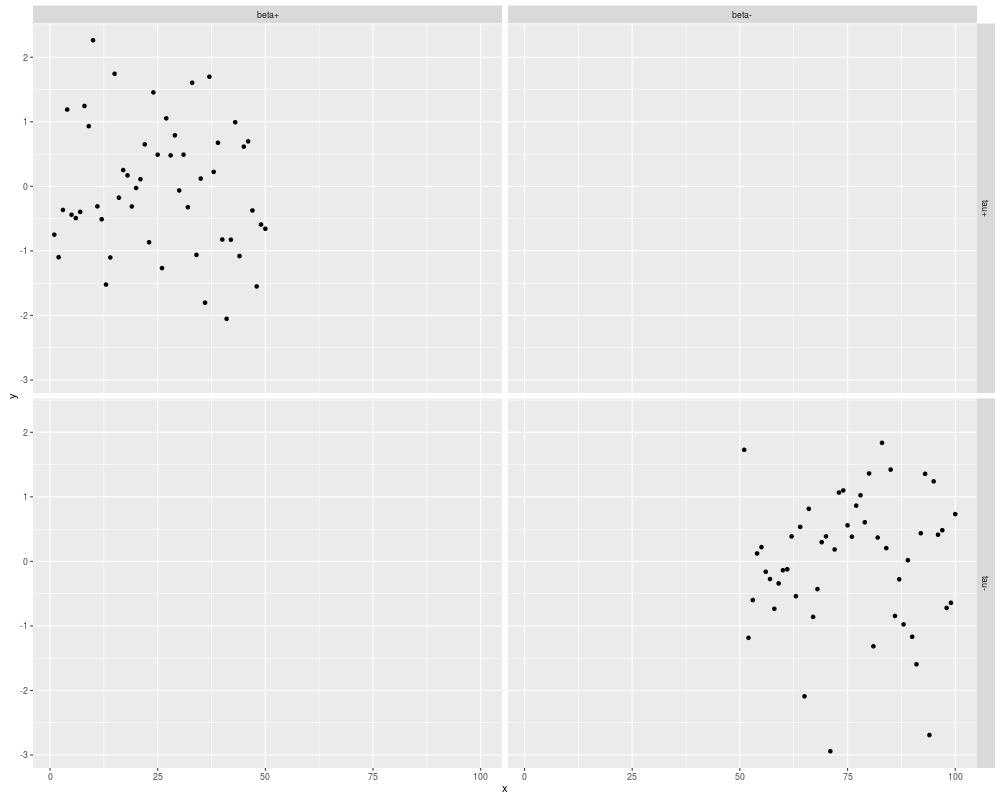
This function works as a labelling mapper for
ggplot2, typically used in facet_grid. All
arguments must be named. Items are mapped as name =>
value, where name represents the original levels of
the factor used for facetting.
Usage
labeller(..., .parse = TRUE)
Arguments
...
A set of named arguments.
.parse
boolean; if TRUE we parse the
text as though it were an expression.
R version 3.3.1 (2016-06-21) -- "Bug in Your Hair"
Copyright (C) 2016 The R Foundation for Statistical Computing
Platform: x86_64-pc-linux-gnu (64-bit)

R is free software and comes with ABSOLUTELY NO WARRANTY.
You are welcome to redistribute it under certain conditions.
Type 'license()' or 'licence()' for distribution details.

R is a collaborative project with many contributors.
Type 'contributors()' for more information and
'citation()' on how to cite R or R packages in publications.

Type 'demo()' for some demos, 'help()' for on-line help, or
'help.start()' for an HTML browser interface to help.
Type 'q()' to quit R.

> library(Kmisc)
> png(filename="/home/ddbj/snapshot/RGM3/R_CC/result/Kmisc/labeller.Rd_%03d_medium.png", width=480, height=480)
> ### Name: labeller
> ### Title: ggplot2 labeller
> ### Aliases: labeller
>
> ### ** Examples
>
> if (require(ggplot2)) {
+
+   df <- data.frame(
+     x=1:100,
+     y=rnorm(100),
+     grp=rep( c("tau+", "tau-"), each=50 ) ## levels are "tau+", "tau-"
+   )
+
+   f <- labeller(
+     `tau-` = 'tau["-"]',
+     `tau+` = 'tau["+"]'
+   )
+
+   ggplot(df, aes(x=x, y=y)) +
+     geom_point() +
+     facet_grid(". ~ grp", labeller=f)
+
+   df$grp2 <- factor(rep( c("beta+", "beta-"), each=50 ))
+
+   f <- labeller(
+     `tau-` = 'tau["-"]',
+     `tau+` = 'tau["+"]',
+     `beta+` = 'beta["+"]',
+     `beta-` = 'beta["-"]'
+   )
+
+   ggplot(df, aes(x=x, y=y)) +
+     geom_point() +
+     facet_grid("grp ~ grp2", labeller=f)
+ }
Loading required package: ggplot2

Attaching package: 'ggplot2'

The following object is masked from 'package:Kmisc':

    labeller

>
>
>
>
>
> dev.off()
null device
          1
>
 .
.