R: Construct a Probability-Probability Plot from a Set of...
pp_plot
R Documentation
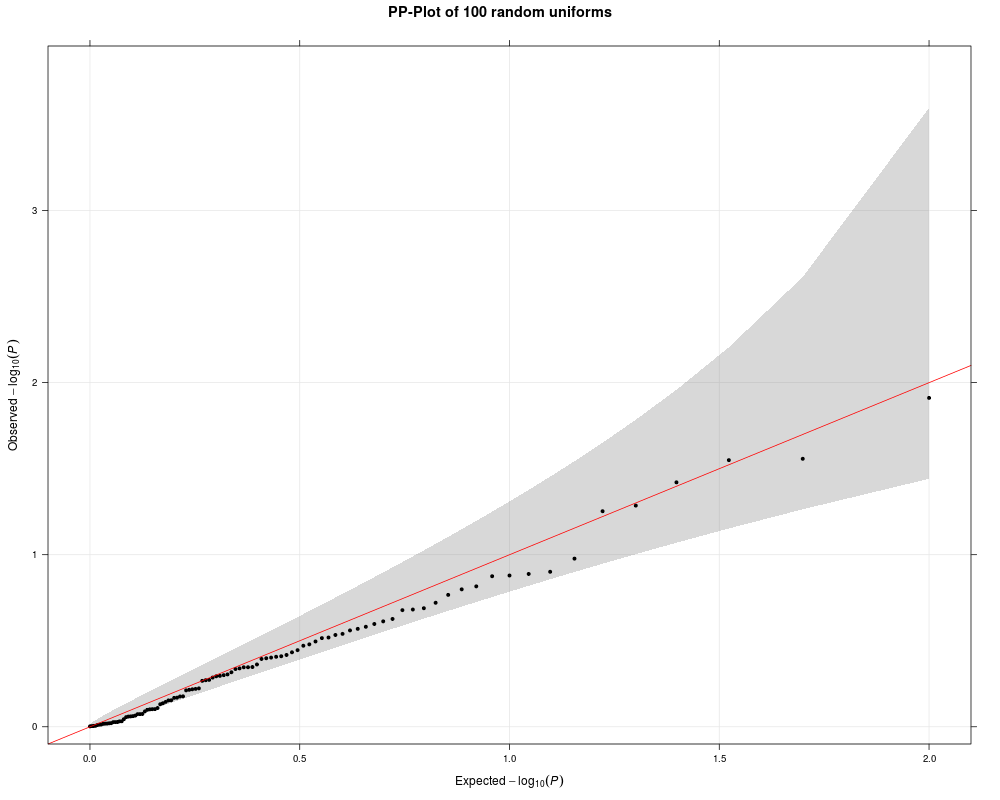
Construct a Probability-Probability Plot from a Set of P-Values
Description
This function constructs a probability-probability plot as
based on a vector of p-values.
Usage
pp_plot(x, ...)
Arguments
x
A vector of p-values; numbers within the range 0
to 1.
...
Optional arguments passed to
xyplot. Note that a custom panel function
is used for generating the plot and hence you shouldn't
try to generate your own panel function.
Examples
pp_plot( runif(100), main="PP-Plot of 100 random uniforms" )
Results
R version 3.3.1 (2016-06-21) -- "Bug in Your Hair"
Copyright (C) 2016 The R Foundation for Statistical Computing
Platform: x86_64-pc-linux-gnu (64-bit)

R is free software and comes with ABSOLUTELY NO WARRANTY.
You are welcome to redistribute it under certain conditions.
Type 'license()' or 'licence()' for distribution details.

R is a collaborative project with many contributors.
Type 'contributors()' for more information and
'citation()' on how to cite R or R packages in publications.

Type 'demo()' for some demos, 'help()' for on-line help, or
'help.start()' for an HTML browser interface to help.
Type 'q()' to quit R.

> library(Kmisc)
> png(filename="/home/ddbj/snapshot/RGM3/R_CC/result/Kmisc/pp_plot.Rd_%03d_medium.png", width=480, height=480)
> ### Name: pp_plot
> ### Title: Construct a Probability-Probability Plot from a Set of P-Values
> ### Aliases: pp_plot
>
> ### ** Examples
>
> pp_plot( runif(100), main="PP-Plot of 100 random uniforms" )
>
>
>
>
>
> dev.off()
null device
          1
>
 .
.