Supported by Dr. Osamu Ogasawara and  . . |
|
Last data update: 2014.03.03 |
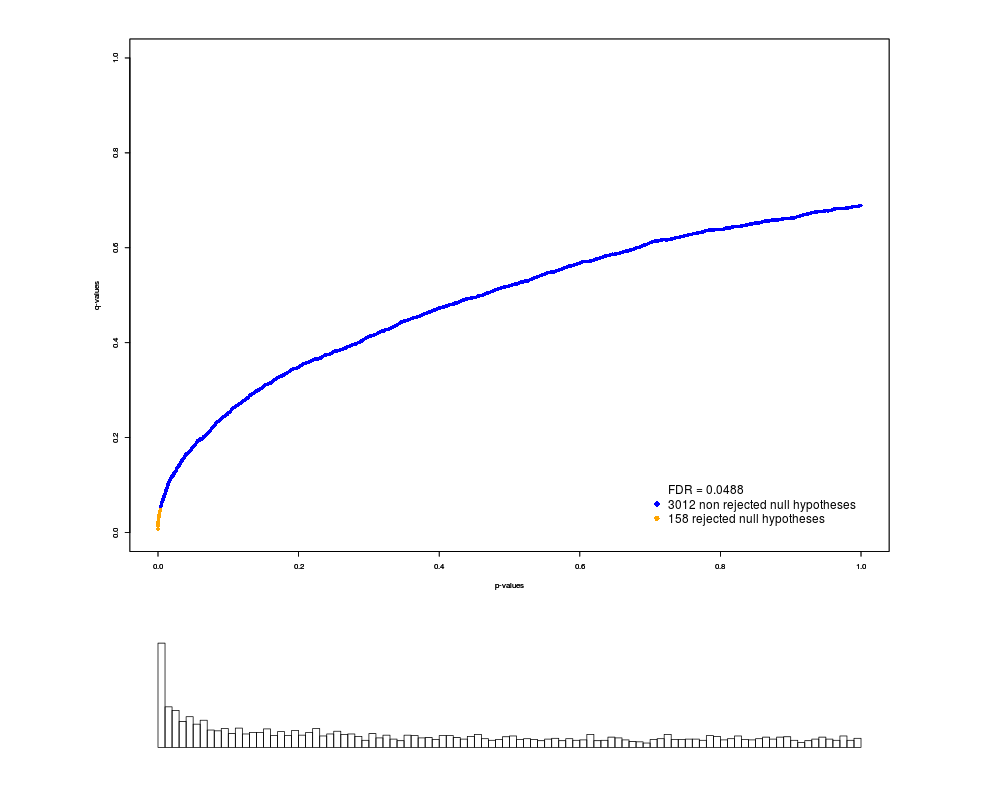
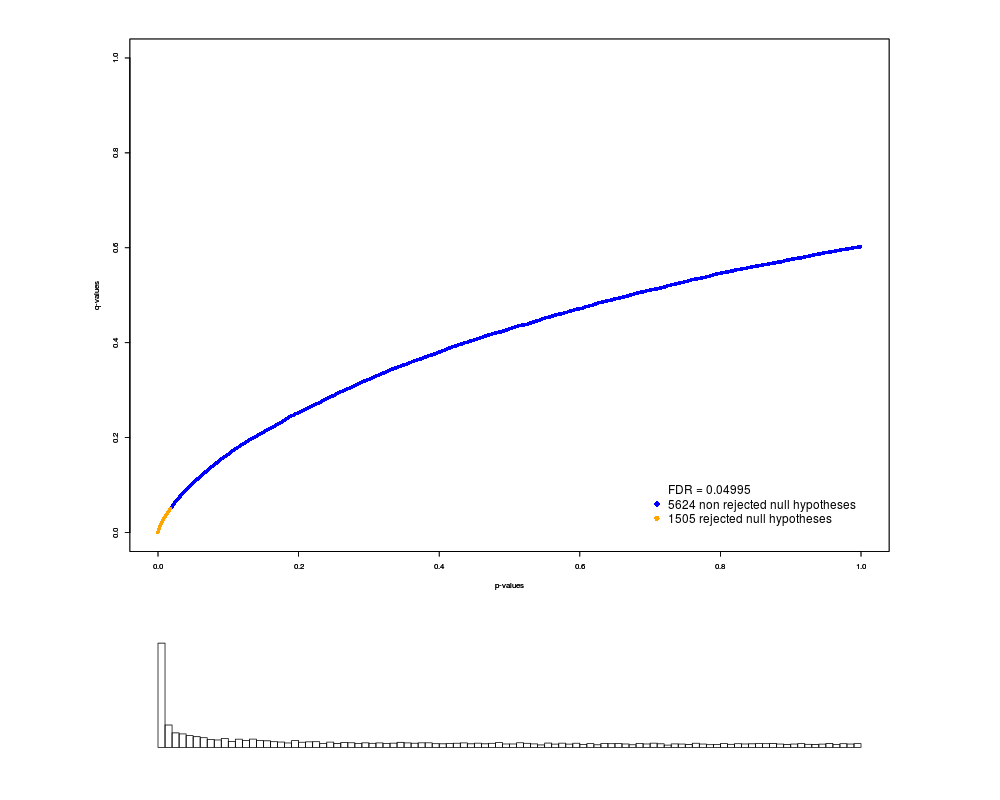
Estimation of the false discovery rate.DescriptionLBE is an efficient procedure for estimating the proportion of true null hypotheses, the false discovery rate and the q-values. UsageLBE(pval, a = NA, l = 0.05, ci.level = 0.95, qvalues = TRUE, plot.type = "main", FDR.level = 0.05, n.significant = NA) Arguments
DetailsThe procedure LBE is based on the expectation of a particular transformation of the p-values leading to a straightforward estimation of the key quantity pi0 that is the proportion of true null hypotheses: pi0(a)={(1/m)*∑_{i=1}^m[-ln(1-pi)]^a}/Γ(a+1), where a belongs to the interval [1;inf). ValueA list containing:
NoteLBE is an alternative method to the one proposed by Storey and Tibshirani
(2003) for estimating the q-values, this latter method being implemented in
the package Author(s)Cyril Dalmasso ReferencesDalmasso C, Broet P, Moreau T (2005). A simple procedure for estimating the false discovery rate. Bioinformatics. Bioinformatics, 21: 660 - 668. Storey JD and Tibshirani R. (2003). Statistical significance for genome-wide studies. Proc Natl Acad Sci, 100, 9440-9445. See Also
Examples## start data(hedenfalk.pval) res=LBE(hedenfalk.pval) data(golub.pval) res=LBE(golub.pval) ## end Results
R version 3.3.1 (2016-06-21) -- "Bug in Your Hair"
Copyright (C) 2016 The R Foundation for Statistical Computing
Platform: x86_64-pc-linux-gnu (64-bit)

R is free software and comes with ABSOLUTELY NO WARRANTY.
You are welcome to redistribute it under certain conditions.
Type 'license()' or 'licence()' for distribution details.

R is a collaborative project with many contributors.
Type 'contributors()' for more information and
'citation()' on how to cite R or R packages in publications.

Type 'demo()' for some demos, 'help()' for on-line help, or
'help.start()' for an HTML browser interface to help.
Type 'q()' to quit R.

> library(LBE)
> png(filename="/home/ddbj/snapshot/RGM3/R_BC/result/LBE/LBE.Rd_%03d_medium.png", width=480, height=480)
> ### Name: LBE
> ### Title: Estimation of the false discovery rate.
> ### Aliases: LBE
> ### Keywords: htest
>
> ### ** Examples
>
> ## start
> data(hedenfalk.pval)
> res=LBE(hedenfalk.pval)
> data(golub.pval)
> res=LBE(golub.pval)
> ## end
>
>
>
>
>
> dev.off()
null device
          1
>
|