Supported by Dr. Osamu Ogasawara and  . . |
|
Last data update: 2014.03.03 |
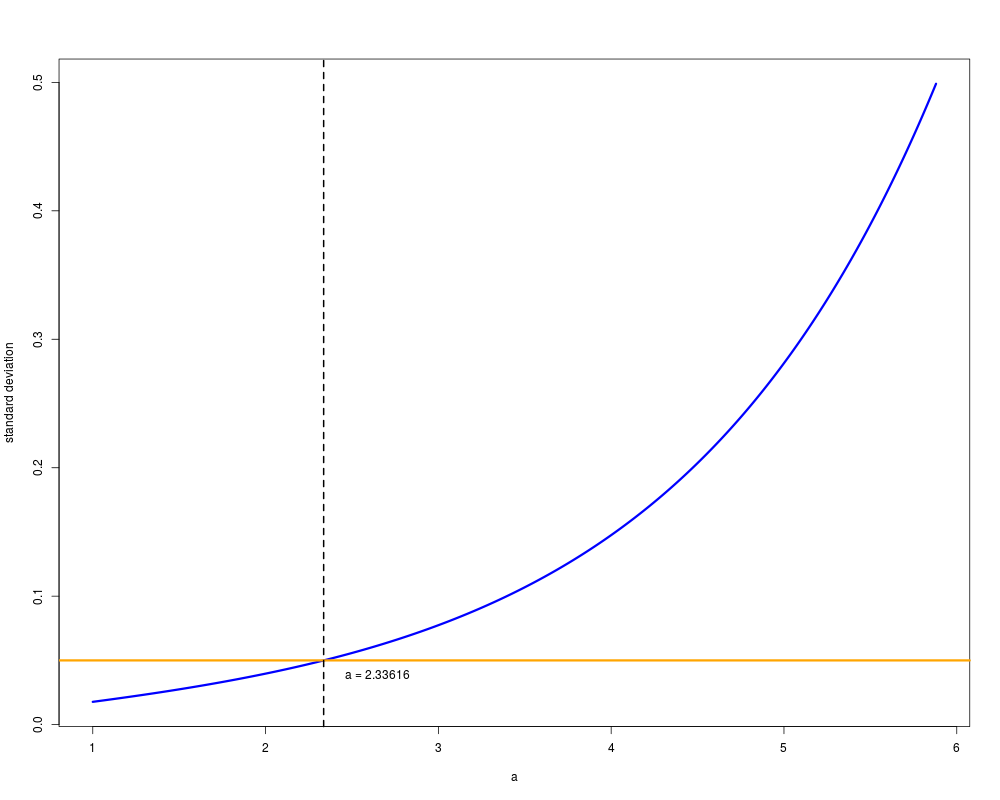
Optimal setting for the parameter aDescriptionThe LBEa function is called by the main function LBE for choosing the greatest value of a such that the upper bound of the asymptotic standard deviation is less than a threshold l. A plot illustrating the relation between a and l for a fixed number of tested hypotheses can also be displayed. UsageLBEa(m, l = 0.05, fig = TRUE, a.rng = NA) Arguments
DetailsThe procedure LBE is based on the expectation of a particular transformation of the p-values leading to a straightforward estimation of the key quantity pi0 that is the proportion of true null hypotheses: pi0(a)={(1/m)*∑_{i=1}^{m}[-ln(1-pi)]^a]}/Γ(a+1) where a belongs to the interval [1;inf). As there is a balance between bias (decreasing as a increase) and variance (increasing as a increase), for a specified number m of tested hypotheses, we have proposed to choose the greatest value of a such that the upper bound of the asymptotic standard deviation of the estimator of pi0 is smaller than the threshold l. The function LBEa allows to plot the standard deviation versus a in order to help for the choice of the threshold l (for a specific number m of tested hypotheses). Value
Author(s)Cyril Dalmasso ReferencesDalmasso C, Broet P, Moreau T (2005). A simple procedure for estimating the false discovery rate. Bioinformatics. Bioinformatics, 21: 660 - 668. See Also
Examples## start data(hedenfalk.pval) m <- length(hedenfalk.pval) LBEa(m,l = 0.05) ## end Results
R version 3.3.1 (2016-06-21) -- "Bug in Your Hair"
Copyright (C) 2016 The R Foundation for Statistical Computing
Platform: x86_64-pc-linux-gnu (64-bit)

R is free software and comes with ABSOLUTELY NO WARRANTY.
You are welcome to redistribute it under certain conditions.
Type 'license()' or 'licence()' for distribution details.

R is a collaborative project with many contributors.
Type 'contributors()' for more information and
'citation()' on how to cite R or R packages in publications.

Type 'demo()' for some demos, 'help()' for on-line help, or
'help.start()' for an HTML browser interface to help.
Type 'q()' to quit R.

> library(LBE)
> png(filename="/home/ddbj/snapshot/RGM3/R_BC/result/LBE/LBEa.Rd_%03d_medium.png", width=480, height=480)
> ### Name: LBEa
> ### Title: Optimal setting for the parameter a
> ### Aliases: LBEa
> ### Keywords: misc
>
> ### ** Examples
>
> ## start
> data(hedenfalk.pval)
> m <- length(hedenfalk.pval)
> LBEa(m,l = 0.05)
[1] 2.33616
> ## end
>
>
>
>
>
> dev.off()
null device
          1
>
|