Supported by Dr. Osamu Ogasawara and  . . |
|
Last data update: 2014.03.03 |
Graphical display of LBE objects.DescriptionGraphical display of LBE objects. Usage
LBEplot(LBEobj, rng = c(0, 0.1), plot.type = c("multiple", "main"), legend = TRUE)
Arguments
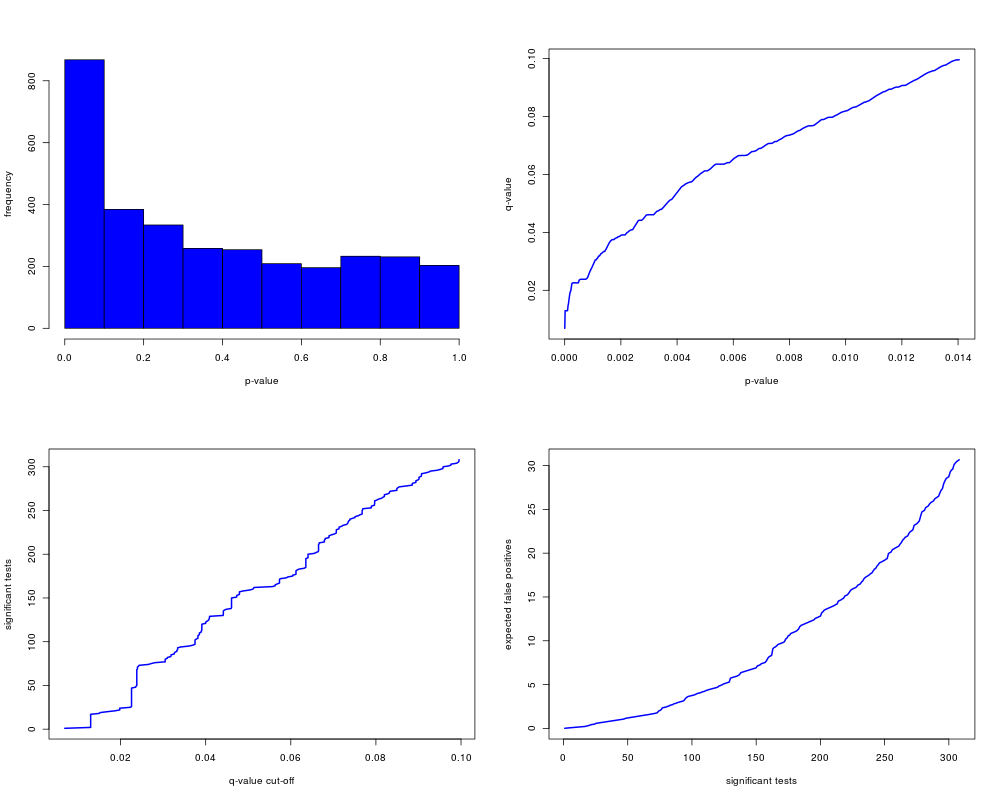
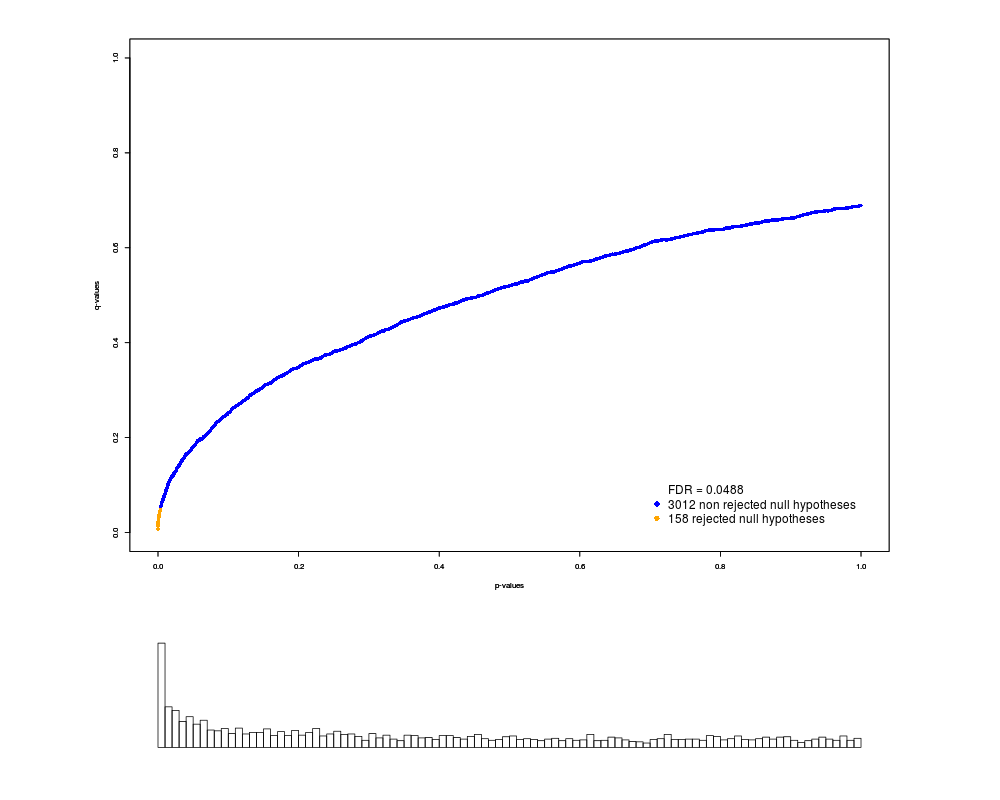
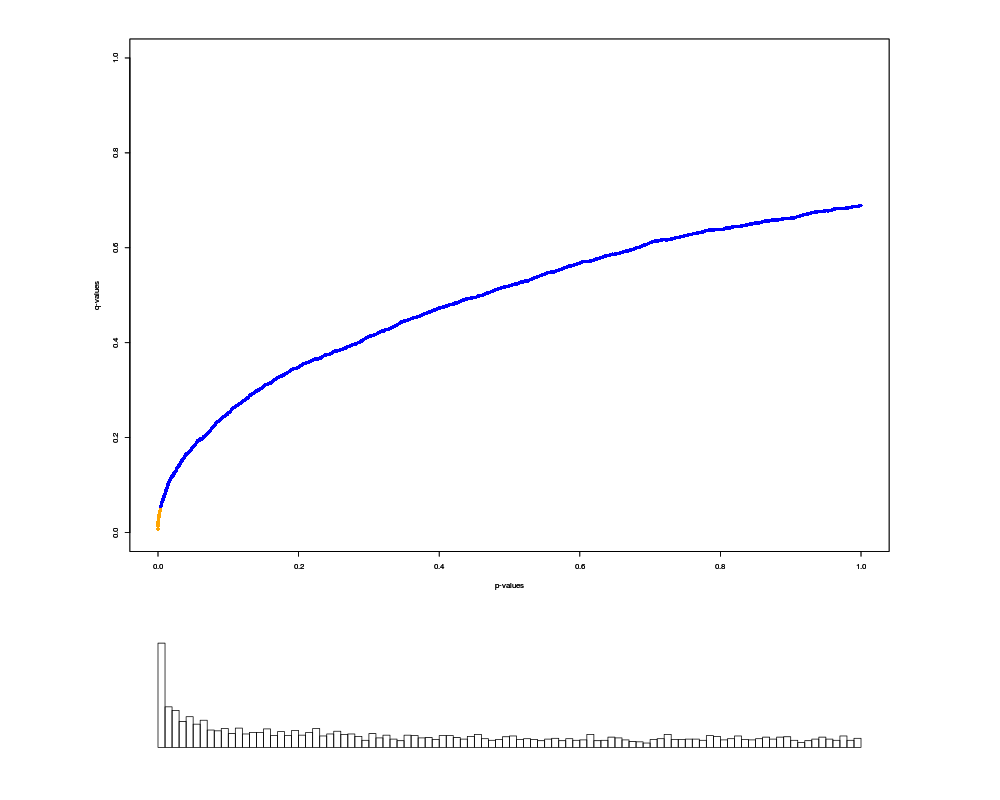
DetailsIf plot.type == "multiple", the following graphics are displayed: 1. The histogram of the p-values. 2. The estimated q-values versus the p-values. 3. The number of significant tests versus each qvalue cutoff. 4. The number of expected false positives versus the number of significant tests. NoteThe function LBEplot is analogous to the function qplot from the package Author(s)Cyril Dalmasso See Also
Examples## start data(hedenfalk.pval) res=LBE(hedenfalk.pval,plot.type="none") LBEplot(res) LBEplot(res,plot.type="main") LBEplot(res,plot.type="main",legend=FALSE) ## end Results
R version 3.3.1 (2016-06-21) -- "Bug in Your Hair"
Copyright (C) 2016 The R Foundation for Statistical Computing
Platform: x86_64-pc-linux-gnu (64-bit)

R is free software and comes with ABSOLUTELY NO WARRANTY.
You are welcome to redistribute it under certain conditions.
Type 'license()' or 'licence()' for distribution details.

R is a collaborative project with many contributors.
Type 'contributors()' for more information and
'citation()' on how to cite R or R packages in publications.

Type 'demo()' for some demos, 'help()' for on-line help, or
'help.start()' for an HTML browser interface to help.
Type 'q()' to quit R.

> library(LBE)
> png(filename="/home/ddbj/snapshot/RGM3/R_BC/result/LBE/LBEplot.Rd_%03d_medium.png", width=480, height=480)
> ### Name: LBEplot
> ### Title: Graphical display of LBE objects.
> ### Aliases: LBEplot
> ### Keywords: htest
>
> ### ** Examples
>
> ## start
> data(hedenfalk.pval)
> res=LBE(hedenfalk.pval,plot.type="none")
> LBEplot(res)
> LBEplot(res,plot.type="main")
> LBEplot(res,plot.type="main",legend=FALSE)
> ## end
>
>
>
>
>
> dev.off()
null device
          1
>
|