Supported by Dr. Osamu Ogasawara and  . . |
|
Last data update: 2014.03.03 |
Write the results of an LBE object to a file.DescriptionWrite the results of an LBE object to a file. UsageLBEwrite(LBEobj, filename = "LBE-results.txt") Arguments
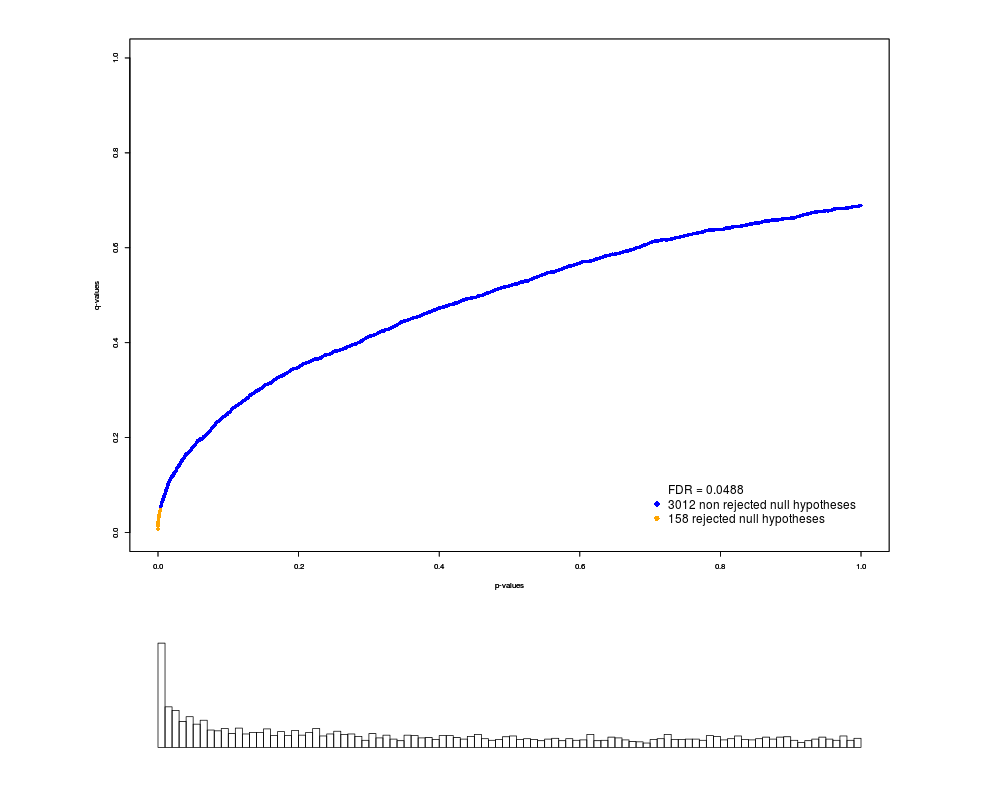
DetailsThe output file lists the estimate of pi0, which is the proportion of true null hypotheses. It also lists each p-value and corresponding q-value, one per line. If an FDR significance level was specified in the call to qvalue, the significance level is printed below the estimate of pi0, and an indicator of significance is included as a third column for each p-value and q-value. NoteThe function LBEwrite is analogous to the function qwrite from the package
Author(s)Cyril Dalmasso See Also
Examples## start data(hedenfalk.pval) res<-LBE(hedenfalk.pval) LBEwrite(res,filename="myresults.txt") ## end Results
R version 3.3.1 (2016-06-21) -- "Bug in Your Hair"
Copyright (C) 2016 The R Foundation for Statistical Computing
Platform: x86_64-pc-linux-gnu (64-bit)

R is free software and comes with ABSOLUTELY NO WARRANTY.
You are welcome to redistribute it under certain conditions.
Type 'license()' or 'licence()' for distribution details.

R is a collaborative project with many contributors.
Type 'contributors()' for more information and
'citation()' on how to cite R or R packages in publications.

Type 'demo()' for some demos, 'help()' for on-line help, or
'help.start()' for an HTML browser interface to help.
Type 'q()' to quit R.

> library(LBE)
> png(filename="/home/ddbj/snapshot/RGM3/R_BC/result/LBE/LBEwrite.Rd_%03d_medium.png", width=480, height=480)
> ### Name: LBEwrite
> ### Title: Write the results of an LBE object to a file.
> ### Aliases: LBEwrite
> ### Keywords: htest
>
> ### ** Examples
>
> ## start
> data(hedenfalk.pval)
> res<-LBE(hedenfalk.pval)
> LBEwrite(res,filename="myresults.txt")
> ## end
>
>
>
>
>
> dev.off()
null device
          1
>
|
Created & Maintained by Osamu Ogasawara (osamu.ogasawara@gmail.com) and 