Supported by Dr. Osamu Ogasawara and  . . |
|
Last data update: 2014.03.03 |
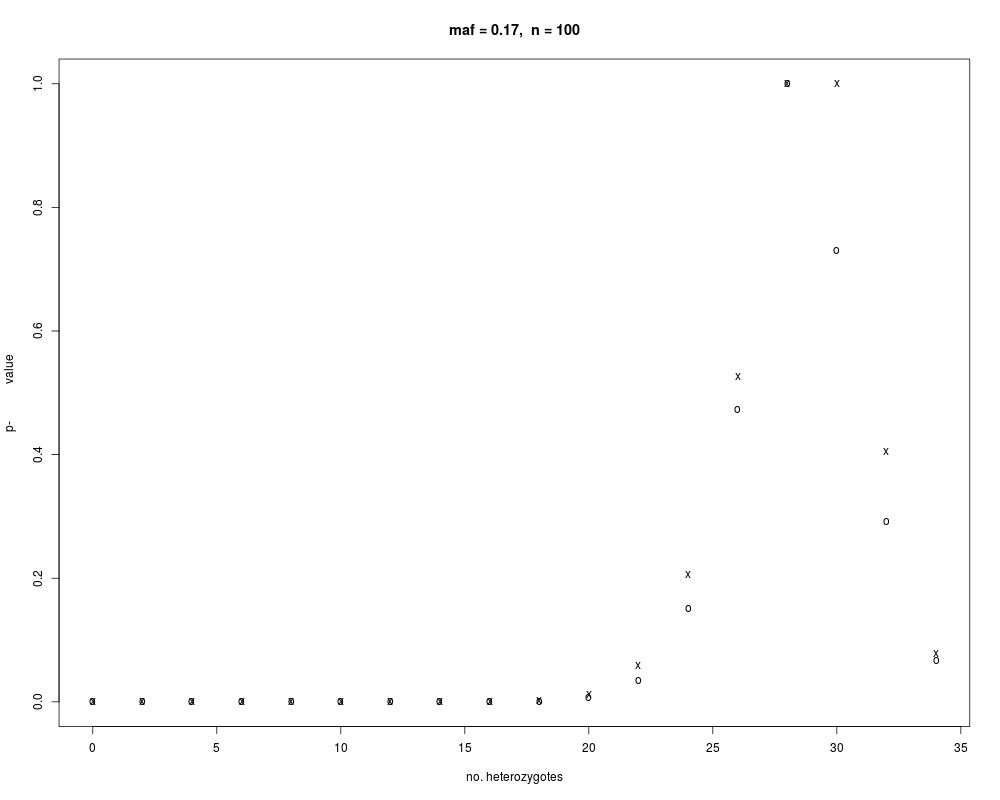
Table and plot of Hardy-Weinberg p-values for all 2x2 tables possible under the null distribution.DescriptionTable and plot of HWE p-values for all possible contingency tables consistent with the margins of the input observed contingency table. See UsageHWE2sided.table(maf, n, ylim = c(0, 1), xlim = NULL) Arguments
ValueOutputs the table of HWE p-values for all the contingency tables consistent with the margins of the input table. Author(s)Alex Lewin ReferencesKulinskaya and Lewin 2008 See Also
ExamplesHWE2sided.table(0.17,100) geno <- c(20,73,7) HWE2sided(geno) Results
R version 3.3.1 (2016-06-21) -- "Bug in Your Hair"
Copyright (C) 2016 The R Foundation for Statistical Computing
Platform: x86_64-pc-linux-gnu (64-bit)

R is free software and comes with ABSOLUTELY NO WARRANTY.
You are welcome to redistribute it under certain conditions.
Type 'license()' or 'licence()' for distribution details.

R is a collaborative project with many contributors.
Type 'contributors()' for more information and
'citation()' on how to cite R or R packages in publications.

Type 'demo()' for some demos, 'help()' for on-line help, or
'help.start()' for an HTML browser interface to help.
Type 'q()' to quit R.

> library(LDtests)
> png(filename="/home/ddbj/snapshot/RGM3/R_CC/result/LDtests/HWE2sided.table.Rd_%03d_medium.png", width=480, height=480)
> ### Name: HWE2sided.table
> ### Title: Table and plot of Hardy-Weinberg p-values for all 2x2 tables
> ###   possible under the null distribution.
> ### Aliases: HWE2sided.table
> ### Keywords: htest
>
> ### ** Examples
>
> HWE2sided.table(0.17,100)
   no. het pval.inbred pval.Hald pval.cond
1        0      0.0000    0.0000    0.0000
2        2      0.0000    0.0000    0.0000
3        4      0.0000    0.0000    0.0000
4        6      0.0000    0.0000    0.0000
5        8      0.0000    0.0000    0.0000
6       10      0.0000    0.0000    0.0000
7       12      0.0000    0.0000    0.0000
8       14      0.0000    0.0000    0.0000
9       16      0.0001    0.0001    0.0002
10      18      0.0011    0.0011    0.0019
11      20      0.0071    0.0071    0.0125
12      22      0.0337    0.0337    0.0593
13      24      0.1171    0.1507    0.2058
14      26      0.2991    0.4735    0.5258
15      28      0.5689    1.0000    1.0000
16      30      0.8256    0.7303    1.0000
17      32      0.9664    0.2915    0.4045
18      34      1.0000    0.0674    0.0780
> geno <- c(20,73,7)
> HWE2sided(geno)
$pval.cond
[1] 0.01248399

$pval.H
[1] 0.007101873

$pval.inbreed
[1] 0.007101873

>
>
>
>
>
> dev.off()
null device
          1
>
|
Created & Maintained by Osamu Ogasawara (osamu.ogasawara@gmail.com) and 