Supported by Dr. Osamu Ogasawara and  . . |
|
Last data update: 2014.03.03 |
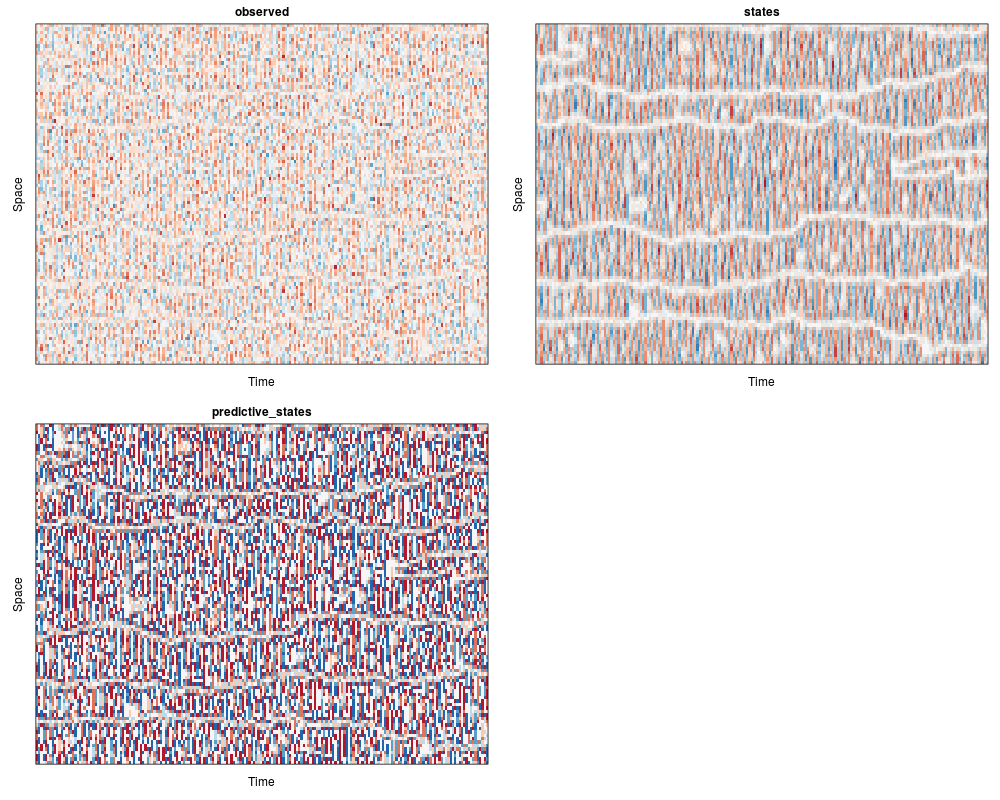
Simulated 7 state (1+1)D fieldDescriptionSimulated 7 state (1+1)D field FormatContains the running example dataset used in hard LICORS & mixed LICORS. A list with three (1+1)D fields, each one extending over N = 100 pixels in space, and T = 200 over time:
ReferencesExamples
# set original par parameters
op <- par(no.readonly = TRUE)

data(contCA00)
par(mfrow = c(2, 2), mar = c(3, 3, 2, 1))
for (ii in 1:3) {
    image2(contCA00[[ii]], legend = FALSE, col = "RdBu", main = attr(summary(contCA00),
        "dimnames")[[1]][ii])
    mtext("Time", 1, 1)
    mtext("Space", 2, 1)
}
par(op)
## Not run:
LC_geom <- setup_LC_geometry(speed = 1, horizon = list(PLC = 2, FLC = 0),
    shape = "cone")
bb <- data2LCs(contCA00$observed, LC.coordinates = LC_geom$coordinates)
image2(bb$PLC)
image2(cor(bb$PLC), zlim = c(-1, 1), col = "RdBu")
mod_kk <- kmeanspp(bb$PLC, k = 10)
plot(bb$FLC, col = mod_kk$cluster, pch = ".", cex = 3)

ff <- estimate_LC_pdfs(bb$FLC, states = mod_kk$cluster, method = "nonparametric")
matplot(bb$FLC, ff, pch = ".", cex = 2)

## End(Not run)
Results
R version 3.3.1 (2016-06-21) -- "Bug in Your Hair"
Copyright (C) 2016 The R Foundation for Statistical Computing
Platform: x86_64-pc-linux-gnu (64-bit)

R is free software and comes with ABSOLUTELY NO WARRANTY.
You are welcome to redistribute it under certain conditions.
Type 'license()' or 'licence()' for distribution details.

R is a collaborative project with many contributors.
Type 'contributors()' for more information and
'citation()' on how to cite R or R packages in publications.

Type 'demo()' for some demos, 'help()' for on-line help, or
'help.start()' for an HTML browser interface to help.
Type 'q()' to quit R.

> library(LICORS)
> png(filename="/home/ddbj/snapshot/RGM3/R_CC/result/LICORS/contCA00.Rd_%03d_medium.png", width=480, height=480)
> ### Name: contCA00
> ### Title: Simulated 7 state (1+1)D field
> ### Aliases: contCA00
> ### Keywords: dataset datasets
>
> ### ** Examples
>
> # set original par parameters
> op <- par(no.readonly = TRUE)
>
> data(contCA00)
> par(mfrow = c(2, 2), mar = c(3, 3, 2, 1))
> for (ii in 1:3) {
+     image2(contCA00[[ii]], legend = FALSE, col = "RdBu", main = attr(summary(contCA00),
+         "dimnames")[[1]][ii])
+     mtext("Time", 1, 1)
+     mtext("Space", 2, 1)
+ }
> par(op)
> ## Not run:
> ##D LC_geom <- setup_LC_geometry(speed = 1, horizon = list(PLC = 2, FLC = 0),
> ##D     shape = "cone")
> ##D bb <- data2LCs(contCA00$observed, LC.coordinates = LC_geom$coordinates)
> ##D image2(bb$PLC)
> ##D image2(cor(bb$PLC), zlim = c(-1, 1), col = "RdBu")
> ##D mod_kk <- kmeanspp(bb$PLC, k = 10)
> ##D plot(bb$FLC, col = mod_kk$cluster, pch = ".", cex = 3)
> ##D
> ##D ff <- estimate_LC_pdfs(bb$FLC, states = mod_kk$cluster, method = "nonparametric")
> ##D matplot(bb$FLC, ff, pch = ".", cex = 2)
> ## End(Not run)
>
>
>
>
>
> dev.off()
null device
          1
>
|
Created & Maintained by Osamu Ogasawara (osamu.ogasawara@gmail.com) and 