Supported by Dr. Osamu Ogasawara and  . . |
|
Last data update: 2014.03.03 |
Kmeans++Descriptionkmeans++ clustering (see References) using R's
built-in function Usagekmeanspp(data, k = 2, start = "random", iter.max = 100, nstart = 10, ...) Arguments
ReferencesArthur, D. and S. Vassilvitskii (2007). “k-means++: The advantages of careful seeding.” In H. Gabow (Ed.), Proceedings of the 18th Annual ACM-SIAM Symposium on Discrete Algorithms [SODA07], Philadelphia, pp. 1027-1035. Society for Industrial and Applied Mathematics. See Also
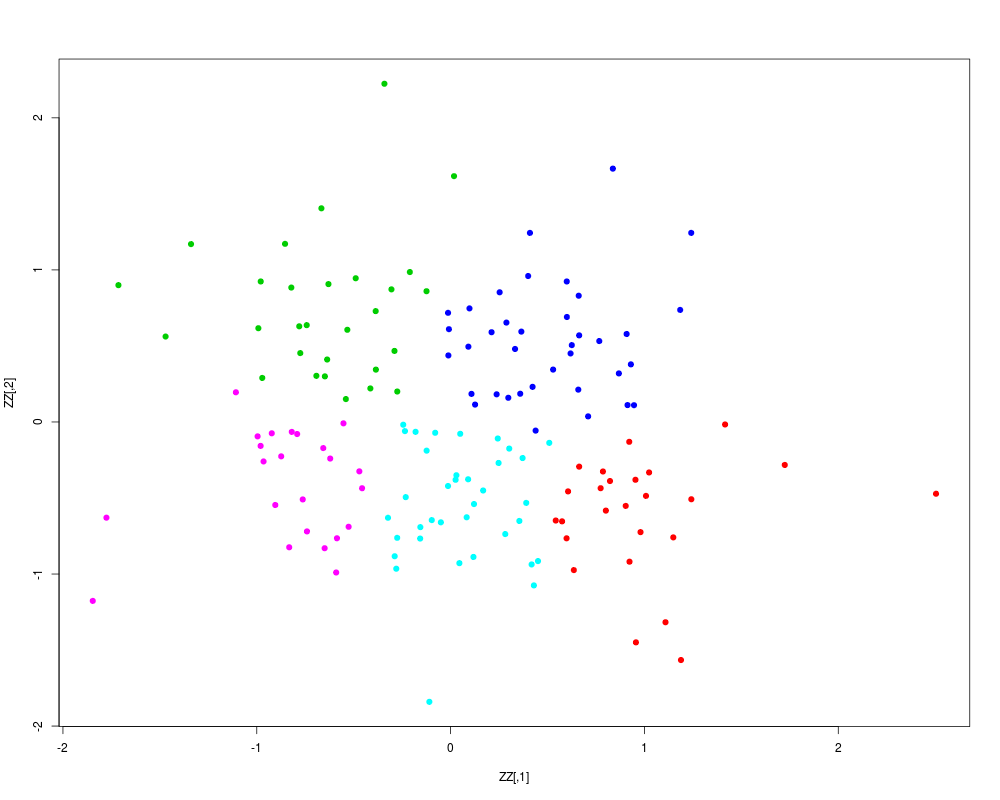
Examplesset.seed(1984) nn <- 100 XX <- matrix(rnorm(nn), ncol = 2) YY <- matrix(runif(length(XX) * 2, -1, 1), ncol = ncol(XX)) ZZ <- rbind(XX, YY) cluster_ZZ <- kmeanspp(ZZ, k = 5, start = "random") plot(ZZ, col = cluster_ZZ$cluster + 1, pch = 19) Results
R version 3.3.1 (2016-06-21) -- "Bug in Your Hair"
Copyright (C) 2016 The R Foundation for Statistical Computing
Platform: x86_64-pc-linux-gnu (64-bit)

R is free software and comes with ABSOLUTELY NO WARRANTY.
You are welcome to redistribute it under certain conditions.
Type 'license()' or 'licence()' for distribution details.

R is a collaborative project with many contributors.
Type 'contributors()' for more information and
'citation()' on how to cite R or R packages in publications.

Type 'demo()' for some demos, 'help()' for on-line help, or
'help.start()' for an HTML browser interface to help.
Type 'q()' to quit R.

> library(LICORS)
> png(filename="/home/ddbj/snapshot/RGM3/R_CC/result/LICORS/kmeanspp.Rd_%03d_medium.png", width=480, height=480)
> ### Name: kmeanspp
> ### Title: Kmeans++
> ### Aliases: kmeanspp
> ### Keywords: cluster multivariate
>
> ### ** Examples
>
> set.seed(1984)
> nn <- 100
> XX <- matrix(rnorm(nn), ncol = 2)
> YY <- matrix(runif(length(XX) * 2, -1, 1), ncol = ncol(XX))
> ZZ <- rbind(XX, YY)
>
> cluster_ZZ <- kmeanspp(ZZ, k = 5, start = "random")
>
> plot(ZZ, col = cluster_ZZ$cluster + 1, pch = 19)
>
>
>
>
>
> dev.off()
null device
          1
>
|
Created & Maintained by Osamu Ogasawara (osamu.ogasawara@gmail.com) and 