Supported by Dr. Osamu Ogasawara and  . . |
|
Last data update: 2014.03.03 |
A blending problem specificationDescriptionA manufacturer produces a feeding mix for pet animals. The feed mix contains two nutritive ingredients and one ingredient (filler) to provide bulk. One kg of feed mix must contain a minimum quantity of each of four nutrients as below:
The ingredients have the following nutrient values and cost
The linear inverse models LIMBlending and LIMinputBlending are generated
from the file Blending.input
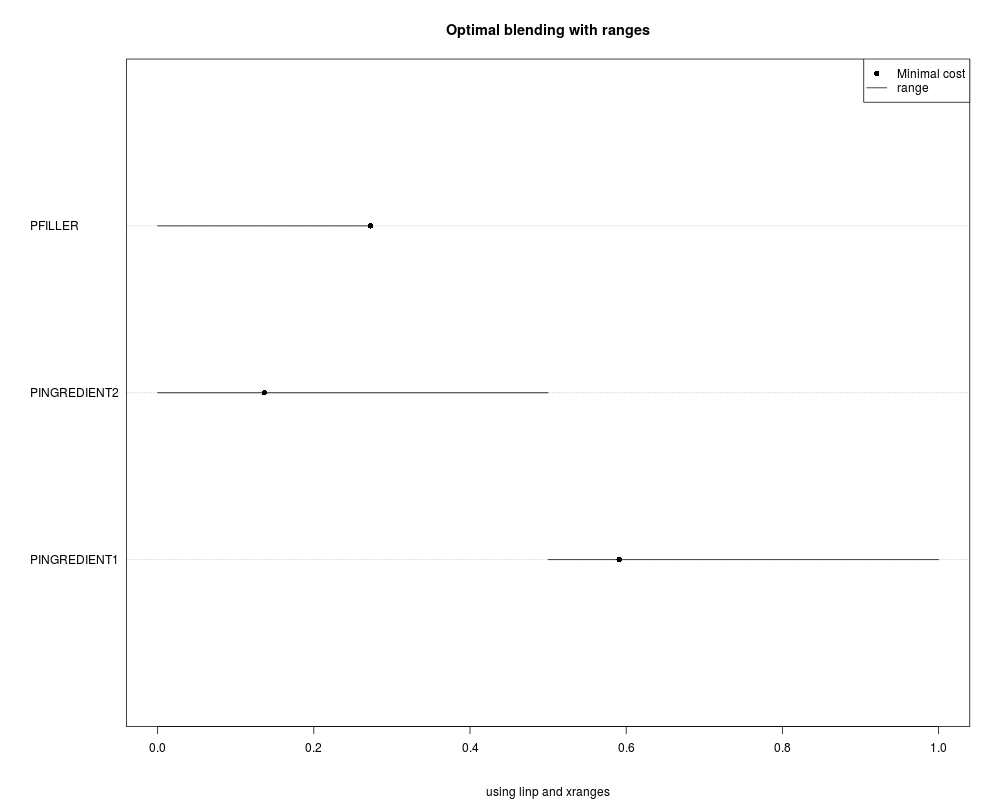
which can be found in subdirectory LIMBlending is generated by function LIMinputBlending is generated by function The problem is to find the composition of the feeding mix that minimises the production costs subject to the constraints above. Stated otherwise: what is the optimal amount of ingredients in one kg of feeding mix? Mathematically this can be estimated by solving a linear programming problem: min(∑ {Cost_i*x_i}) subject to x_i>=0 Ex=f Gx>=h Where the x_1*40+x_2*60 The 1 = x_1+x_2+x_3 And the 100*x_1+200*x_2>80 50*x_1+150*x_2>50 and so on The solution is Ingredient1 (x1) = 0.5909, Ingredient2 (x2)=0.1364 and Filler (x3)=0.2727. UsageLIMBlending LIMinputBlending FormatLIMBlending is of type see the return value of LIMinputBlending is of type A more complete description of these structures is in vignette("LIM") Author(s)Karline Soetaert <karline.soetaert@nioz.nl> See AlsobrowseURL(paste(system.file(package="LIM"), "/doc/examples/LinearProg/", sep="")) contains "blending.input", the input file; read this with
Examples
# 1. Solve the model with linear programming
res <- Linp(LIMBlending, ispos = TRUE)

# show results
print(c(res$X, Cost = res$solutionNorm))


# 2. Possible ranges of the three ingredients
(xr <- Xranges(LIMBlending, ispos = TRUE))
Nx <- LIMBlending$NUnknowns

# plot
dotchart(x = as.vector(res$X), xlim = range(xr),
         labels = LIMBlending$Unknowns,
         main = "Optimal blending with ranges",
         sub = "using linp and xranges", pch = 16)
segments(xr[ ,1], 1:Nx, xr[ ,2], 1:Nx)
legend  ("topright", pch = c(16, NA), lty = c(NA, 1),
          legend = c("Minimal cost", "range"))

# 3. Random sample of the three ingredients
# The inequality that all x > 0 has to be added!
blend   <- LIMBlending
blend$G <- rbind(blend$G, diag(3))
blend$H <- c(blend$H, rep(0, 3))

xs <- Xsample(blend)

pairs(xs, main = "Blending, 3000 solutions with xsample")
Results
R version 3.3.1 (2016-06-21) -- "Bug in Your Hair"
Copyright (C) 2016 The R Foundation for Statistical Computing
Platform: x86_64-pc-linux-gnu (64-bit)

R is free software and comes with ABSOLUTELY NO WARRANTY.
You are welcome to redistribute it under certain conditions.
Type 'license()' or 'licence()' for distribution details.

R is a collaborative project with many contributors.
Type 'contributors()' for more information and
'citation()' on how to cite R or R packages in publications.

Type 'demo()' for some demos, 'help()' for on-line help, or
'help.start()' for an HTML browser interface to help.
Type 'q()' to quit R.

> library(LIM)
Loading required package: limSolve
Loading required package: diagram
Loading required package: shape
> png(filename="/home/ddbj/snapshot/RGM3/R_CC/result/LIM/LIMBlending.Rd_%03d_medium.png", width=480, height=480)
> ### Name: LIMBlending
> ### Title: A blending problem specification
> ### Aliases: LIMinputBlending LIMBlending
> ### Keywords: datasets
>
> ### ** Examples
>
>
> # 1. Solve the model with linear programming
> res <- Linp(LIMBlending, ispos = TRUE)
>
> # show results
> print(c(res$X, Cost = res$solutionNorm))
                                       Cost
 0.5909091  0.1363636  0.2727273 31.8181818
>
>
> # 2. Possible ranges of the three ingredients
> (xr <- Xranges(LIMBlending, ispos = TRUE))
             min       max
PINGREDIENT1 0.5 1.0000000
PINGREDIENT2 0.0 0.5000000
PFILLER      0.0 0.2727273
> Nx <- LIMBlending$NUnknowns
>
> # plot
> dotchart(x = as.vector(res$X), xlim = range(xr),
+          labels = LIMBlending$Unknowns,
+          main = "Optimal blending with ranges",
+          sub = "using linp and xranges", pch = 16)
> segments(xr[ ,1], 1:Nx, xr[ ,2], 1:Nx)
> legend  ("topright", pch = c(16, NA), lty = c(NA, 1),
+           legend = c("Minimal cost", "range"))
>
> # 3. Random sample of the three ingredients
> # The inequality that all x > 0 has to be added!
> blend   <- LIMBlending
> blend$G <- rbind(blend$G, diag(3))
> blend$H <- c(blend$H, rep(0, 3))
>
> xs <- Xsample(blend)
Warning message:
In lsei(E = E, F = F, G = G, H = H) : No equalities - setting type = 2
>
> pairs(xs, main = "Blending, 3000 solutions with xsample")
>
>
>
>
>
> dev.off()
null device
          1
>
|