R: Plots the minimum and maximum and central values
Plotranges
R Documentation
Plots the minimum and maximum and central values
Description
Plots minimum and maximum ranges.
Takes as input either a lim list, as generated by Setup or a set
of vectors specifying the minimum, maximum and the central value,
or a data.frame that contains min, max and central values.
Usage
Plotranges(...)
## S3 method for class 'double'
Plotranges(min, max, value = NULL, labels = NULL, log = "",
  pch = 16, pch.col = "black", line.col = "gray",
  seg.col = "black", xlim = NULL, main = NULL,
  xlab = NULL, ylab = NULL, lab.cex = 1.0, mark = NULL,...)

## S3 method for class 'lim'
Plotranges(lim = NULL, labels = NULL, type = "X", log = "",
  pch = 16, pch.col = "black", line.col = "gray",
  seg.col = "black", xlim = NULL, main = NULL,
  xlab = NULL, ylab = NULL, lab.cex = 1.0, index = NULL, ...)

## S3 method for class 'character'
Plotranges(file, ...)
Arguments
min
minimum value.
max
maximum value.
value
median or mean value.
lim
a list that contains the linear inverse model
specification, as generated by function setup.limfile.
file
name of the inverse input file.
labels
names of each value.
type
one of "X" or "V" for plotting of unknowns (X) or variables.
log
if = x: logarithmic scale for x-axis.
pch
pch symbol used for mean value.
pch.col
pch color for mean value.
line.col
color for each variable, spanning x-axis.
seg.col
color for variable range.
xlim
limits on x-axis.
main
main title.
xlab
x-axis label.
ylab
y-axis label.
lab.cex
label expansion value.
index
list of elements to be plotted, a vector of integers;
default = all elements.
mark
list of elements to be marked with a "*", i.e. when range
is unbounded.
...
arguments passed to R-function "text" when writing labels.
Value
Only when a lim list was inputted. A data frame with
min
the minimum.
max
the maximum.
values
the central value.
Author(s)
Karline Soetaert <karline.soetaert@nioz.nl>
Examples
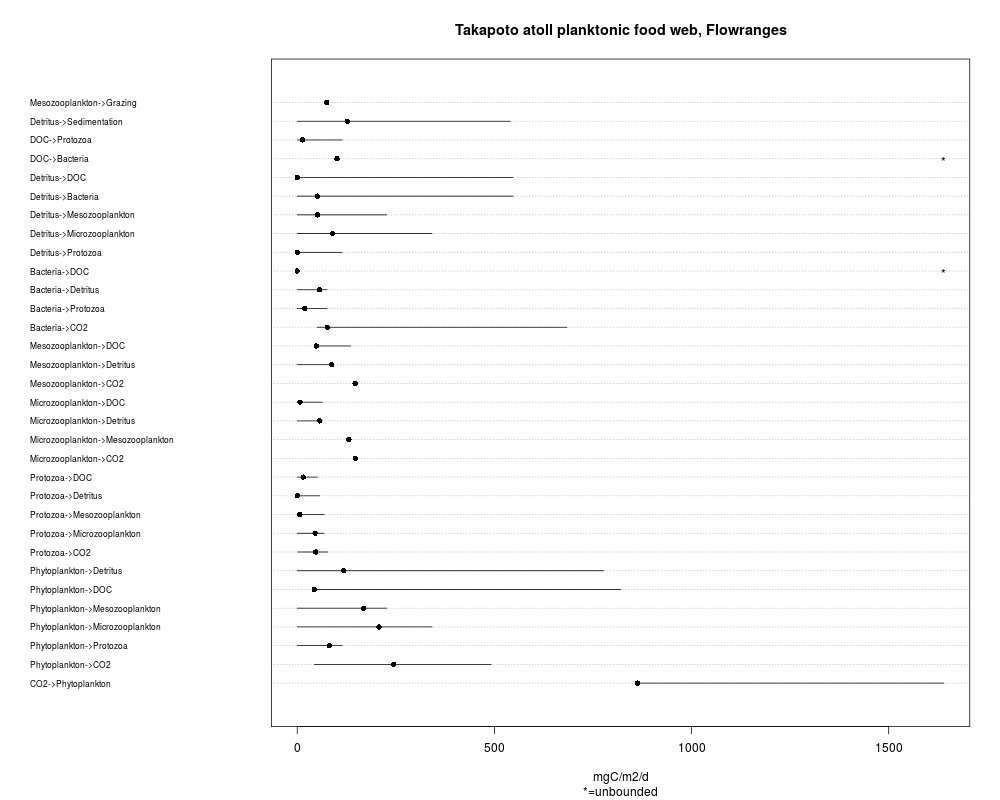
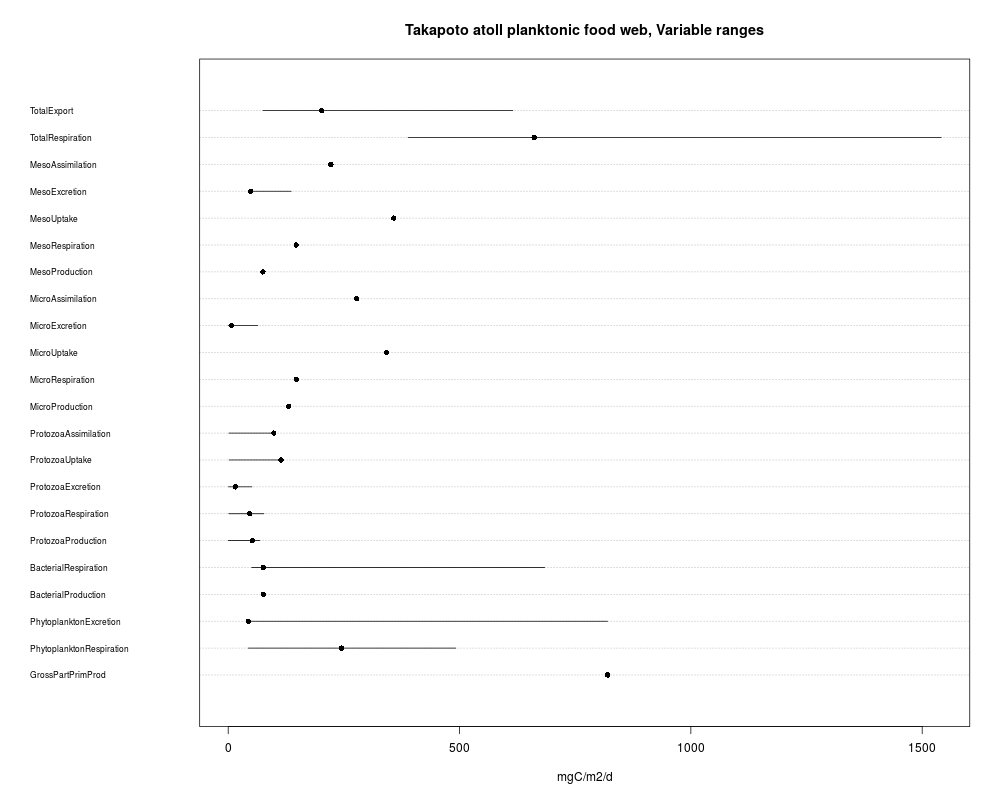
# The Takapoto food web.
# some ranges extend to infinity - they are marked with "*"
Plotranges(LIMTakapoto, lab.cex = 0.7, sub = "*=unbounded",
           xlab = "mgC/m2/d",
           main = "Takapoto atoll planktonic food web, Flowranges")
# ranges of variables, exclude first variable
Plotranges(LIMTakapoto, type = "V", lab.cex = 0.7,
           index = 2:23, xlab = "mgC/m2/d",
           main = "Takapoto atoll planktonic food web, Variable ranges")
Results
R version 3.3.1 (2016-06-21) -- "Bug in Your Hair"
Copyright (C) 2016 The R Foundation for Statistical Computing
Platform: x86_64-pc-linux-gnu (64-bit)

R is free software and comes with ABSOLUTELY NO WARRANTY.
You are welcome to redistribute it under certain conditions.
Type 'license()' or 'licence()' for distribution details.

R is a collaborative project with many contributors.
Type 'contributors()' for more information and
'citation()' on how to cite R or R packages in publications.

Type 'demo()' for some demos, 'help()' for on-line help, or
'help.start()' for an HTML browser interface to help.
Type 'q()' to quit R.

> library(LIM)
Loading required package: limSolve
Loading required package: diagram
Loading required package: shape
> png(filename="/home/ddbj/snapshot/RGM3/R_CC/result/LIM/plotranges.Rd_%03d_medium.png", width=480, height=480)
> ### Name: Plotranges
> ### Title: Plots the minimum and maximum and central values
> ### Aliases: Plotranges Plotranges.double Plotranges.lim
> ###   Plotranges.character
> ### Keywords: hplot
>
> ### ** Examples
>
> # The Takapoto food web.
> # some ranges extend to infinity - they are marked with "*"
> Plotranges(LIMTakapoto, lab.cex = 0.7, sub = "*=unbounded",
+            xlab = "mgC/m2/d",
+            main = "Takapoto atoll planktonic food web, Flowranges")
> # ranges of variables, exclude first variable
> Plotranges(LIMTakapoto, type = "V", lab.cex = 0.7,
+            index = 2:23, xlab = "mgC/m2/d",
+            main = "Takapoto atoll planktonic food web, Variable ranges")
>
>
>
>
>
> dev.off()
null device
          1
>
 .
.