Supported by Dr. Osamu Ogasawara and  . . |
|
Last data update: 2014.03.03 |
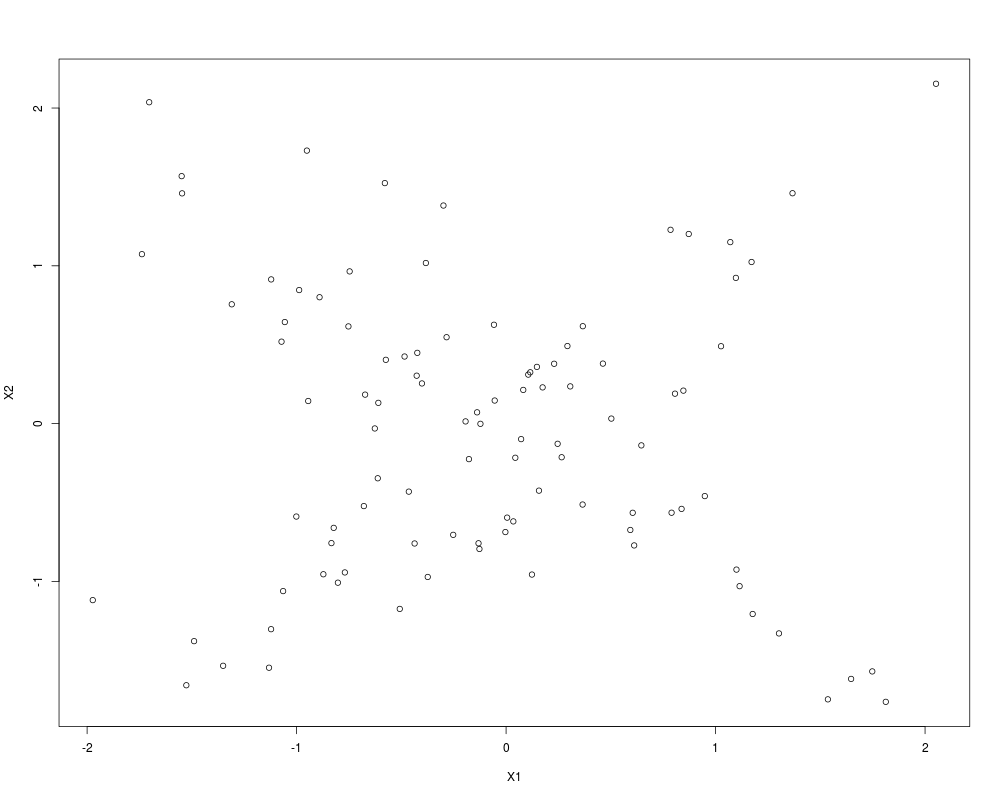
Ln (Longest Increasing Subsequence) statistic, to test independenceDescriptionIt compute the Ln-statistic, from a bivariate sample of continuous random variables X and Y. UsageLn(x, y) Arguments
DetailsSee Section 2.-Main reference. ValueThe value of the Ln-statistic. Author(s)J. E. Garcia and V. A. Gonzalez-Lopez ReferencesJ. E. Garcia, V. A. Gonzalez-Lopez, Independence tests for continuous random variables based on the longest increasing subsequence, Journal of Multivariate Analysis (2014), http://dx.doi.org/10.1016/j.jmva.2014.02.010 Examples## mixture of two bivariate normal, one with correlation ## 0.9 and the other with correlation -0.9 # N <-100 ro<- 0.90 Z1<-rnorm(N) Z2<-rnorm(N) X2<-X1<-Z1 I<-(1:floor(N*0.5)) I2<-((floor(N*0.5)+1):N) X1[I]<-Z1[I] X2[I]<-(Z1[I]*ro+Z2[I]*sqrt(1-ro*ro)) X1[I2]<-Z1[I2] X2[I2]<-(Z1[I2]*(-ro)+Z2[I2]*sqrt(1-ro*ro)) plot(X1,X2) # calculate the statistic a<-Ln(X1,X2) a Results
R version 3.3.1 (2016-06-21) -- "Bug in Your Hair"
Copyright (C) 2016 The R Foundation for Statistical Computing
Platform: x86_64-pc-linux-gnu (64-bit)

R is free software and comes with ABSOLUTELY NO WARRANTY.
You are welcome to redistribute it under certain conditions.
Type 'license()' or 'licence()' for distribution details.

R is a collaborative project with many contributors.
Type 'contributors()' for more information and
'citation()' on how to cite R or R packages in publications.

Type 'demo()' for some demos, 'help()' for on-line help, or
'help.start()' for an HTML browser interface to help.
Type 'q()' to quit R.

> library(LIStest)
> png(filename="/home/ddbj/snapshot/RGM3/R_CC/result/LIStest/Ln.Rd_%03d_medium.png", width=480, height=480)
> ### Name: Ln
> ### Title: Ln (Longest Increasing Subsequence) statistic, to test
> ###   independence
> ### Aliases: Ln
> ### Keywords: ~longest increasing subsequence ~copula
>
> ### ** Examples
>
> ## mixture of two bivariate normal, one with correlation
> ## 0.9 and  the other with correlation -0.9
> #
> N <-100
> ro<- 0.90
> Z1<-rnorm(N)
> Z2<-rnorm(N)
> X2<-X1<-Z1
> I<-(1:floor(N*0.5))
> I2<-((floor(N*0.5)+1):N)
> X1[I]<-Z1[I]
> X2[I]<-(Z1[I]*ro+Z2[I]*sqrt(1-ro*ro))
> X1[I2]<-Z1[I2]
> X2[I2]<-(Z1[I2]*(-ro)+Z2[I2]*sqrt(1-ro*ro))
> plot(X1,X2)
>
> # calculate the statistic
> a<-Ln(X1,X2)
> a
[1] 26
>
>
>
>
>
> dev.off()
null device
          1
>
|
Created & Maintained by Osamu Ogasawara (osamu.ogasawara@gmail.com) and 