Supported by Dr. Osamu Ogasawara and  . . |
|
Last data update: 2014.03.03 |
Dynamic 3d plot for
|
model |
A |
pred |
The quoted name of a model predictor. |
intr |
The quoted name of a continuous model predicor. |
plot.type |
The type of plot to make. Can be any of |
xlim, ylim, zlim |
x-, y- and z-limits. The plot is produced so that the rectangular volume defined by these limits is visible. |
xlab, ylab, zlab |
Titles for the axes. N.B. These must be character strings; expressions are not accepted. Numbers will be coerced to character strings. |
main |
The main title on top of the plot. |
shift |
Constant to add to the smooth (on the scale of the linear predictor) before plotting. Defaults to 0. Passed to |
scale |
Constant by which to multiply the smooth before plotting. Defaults to 1. Passed to |
cex |
The size of label and main text. |
fun |
A function to be applied for transforming the dependent variable, if |
n |
Integer denoting number of points for the plot, chosen at equally spaced intervals across the empirical range of the predictor variable. |
color |
The colour scheme to use for plots. One of |
alpha, alpha.rs, alpha.raw, alpha.u |
For |
lit |
Logical, specifying if lighting calculation should take place on geometry. |
theta |
Angle defining the viewing direction. |
phi |
Angle defining the viewing direction. |
contourstepsize |
The size of the steps from contour line to contour line. |
legend.args |
When |
play3d |
If |
ref.surf |
If |
underneath |
If |
add.raw |
If |
color.raw |
The colour scheme to use for the raw data surface. One of |
rug |
Whether a rug ought to be plotted on the 3d surface. Defaults to |
rug.u |
For |
plot.dat, path |
Whether to cache the plotting data generated by a previous call to |
... |
Further arguments to be passed to |
Details
See help page to Harald Baayen's plotLMER.fnc function as well as to Duncan Murdoch's persp3d function and the help page to function image.plot from package fields. To save screenshots of "persp3d" plots (after plotting), use function rgl.snapshot (produces png files) or function rgl.postscript (produces eps files).
Value
Invisibly returns plotting information (x and y vectors, z matrix, and colors, col). If plot.type = "contour", plot.type = "image.plot", or plot.type = "persp", a contour or perspective plot, respectively. If plot.type = "persp3d", a 2d plot as created by plotLMER.fnc as well as a dynamic 3d plot as created by persp3d. If ret = TRUE, a two-element list is returned containing the matrix and the matrix of corresponding colors is returned. If argument intel in non-null, a file containing plotting information will be saved.
Author(s)
Antoine Tremblay, Dalhousie University, trea26@gmail.com.
See Also
persp;
contour;
plotLMER.fnc.
Examples
if(try(require(LCFdata,quietly=TRUE))){
data(z)
temp.dir <- tempdir()
save(z,file=file.path(temp.dir,"lmer___z.rda"))
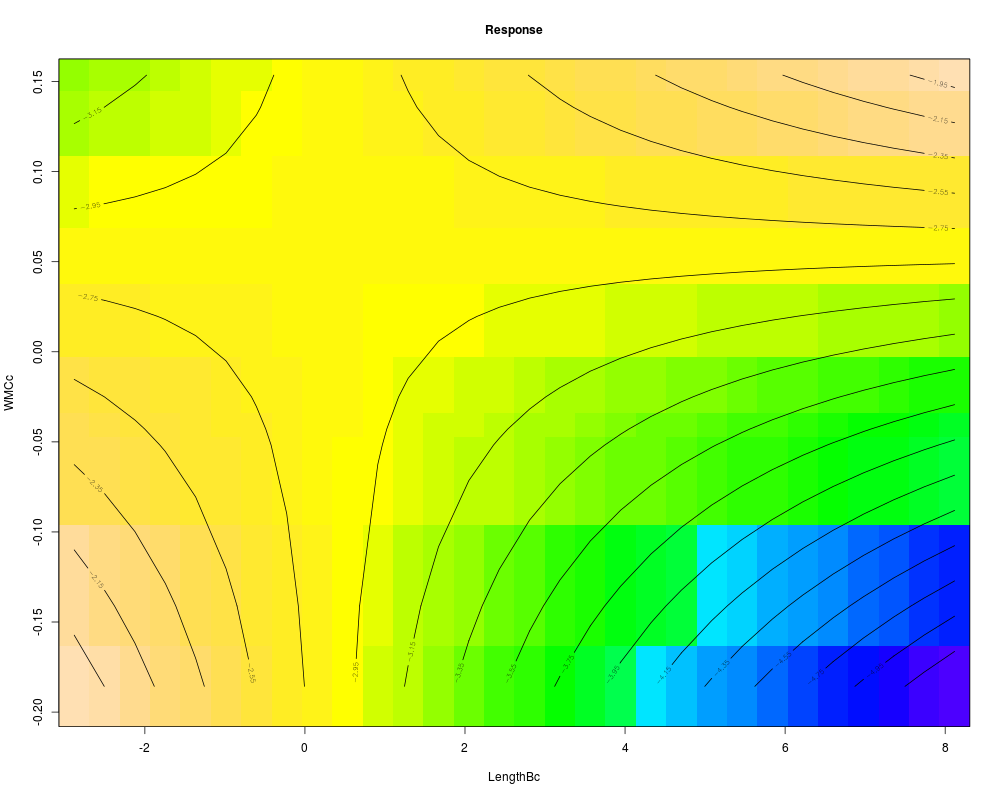
plotLMER3d.fnc(pred = "LengthBc", intr = "WMCc",
plot.dat = "z", path = temp.dir)
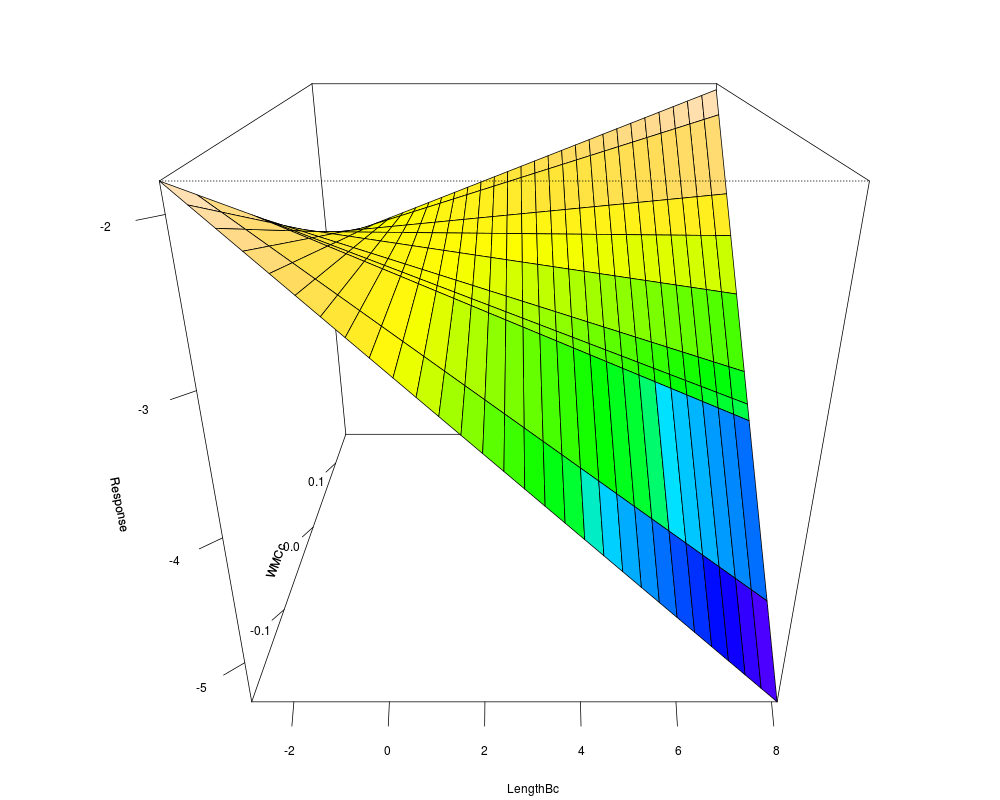
plotLMER3d.fnc(pred = "LengthBc", intr = "WMCc",
plot.type = "persp", phi = 25, plot.dat = "z",
path = temp.dir)
if(try(require(rgl,quietly=TRUE))){
require(rgl)
open3d()
plotLMER3d.fnc(pred = "LengthBc", intr = "WMCc",
plot.type = "persp3d", plot.dat = "z", path = temp.dir)
}
}
Results
R version 3.3.1 (2016-06-21) -- "Bug in Your Hair"
Copyright (C) 2016 The R Foundation for Statistical Computing
Platform: x86_64-pc-linux-gnu (64-bit)

R is free software and comes with ABSOLUTELY NO WARRANTY.
You are welcome to redistribute it under certain conditions.
Type 'license()' or 'licence()' for distribution details.

R is a collaborative project with many contributors.
Type 'contributors()' for more information and
'citation()' on how to cite R or R packages in publications.

Type 'demo()' for some demos, 'help()' for on-line help, or
'help.start()' for an HTML browser interface to help.
Type 'q()' to quit R.

> library(LMERConvenienceFunctions)
> png(filename="/home/ddbj/snapshot/RGM3/R_CC/result/LMERConvenienceFunctions/plotLMER3d.fnc.Rd_%03d_medium.png", width=480, height=480)
> ### Name: plotLMER3d.fnc
> ### Title: Dynamic 3d plot for 'mer' object.
> ### Aliases: plotLMER3d.fnc
> ### Keywords: hplot
>
> ### ** Examples
>
> if(try(require(LCFdata,quietly=TRUE))){
+ 	data(z)
+ 	temp.dir <- tempdir()
+ 	save(z,file=file.path(temp.dir,"lmer___z.rda"))
+
+   plotLMER3d.fnc(pred = "LengthBc", intr = "WMCc",
+     plot.dat = "z", path = temp.dir)
+   plotLMER3d.fnc(pred = "LengthBc", intr = "WMCc",
+     plot.type = "persp", phi = 25, plot.dat = "z",
+     path = temp.dir)
+   if(try(require(rgl,quietly=TRUE))){
+     require(rgl)
+     open3d()
+     plotLMER3d.fnc(pred = "LengthBc", intr = "WMCc",
+       plot.type = "persp3d", plot.dat = "z", path = temp.dir)
+   }
+ }
>
>
>
>
>
> dev.off()
null device
          1
>
|