Supported by Dr. Osamu Ogasawara and  . . |
|
Last data update: 2014.03.03 |
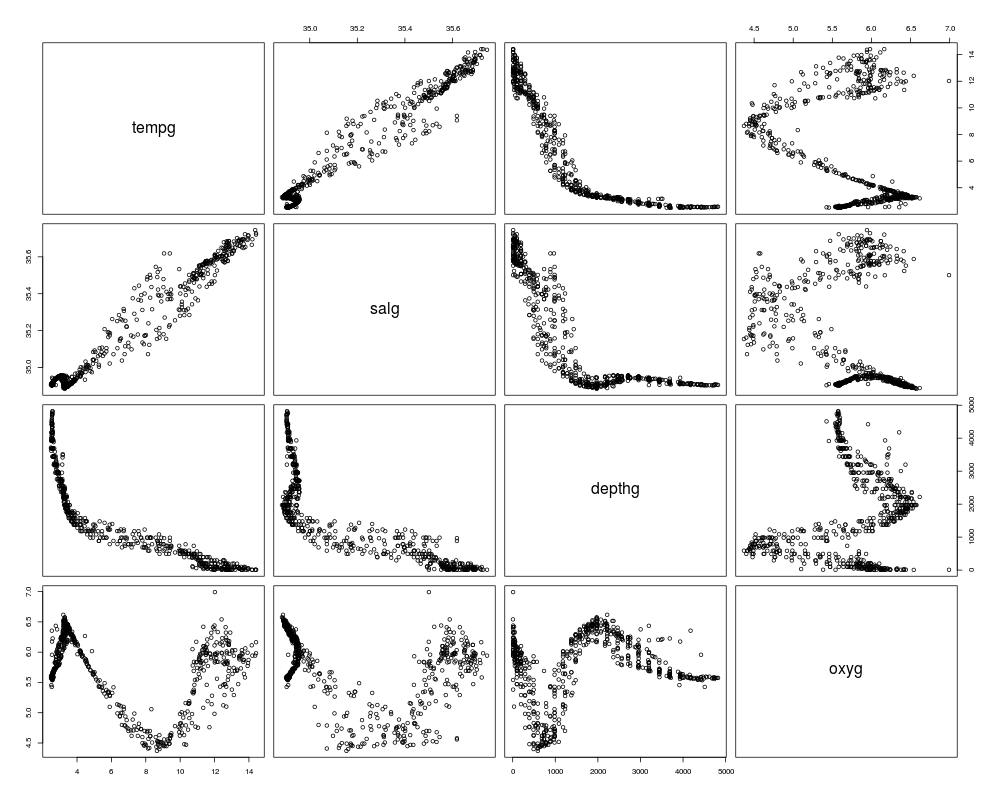
North Atlantic Water Temperature Data.DescriptionThese are observations taken over nine days in May 2000 by the German vessel Gauss in the North Atlantic. Usagedata(gvessel) FormatA data frame with 643 observations on the following 7 variables.
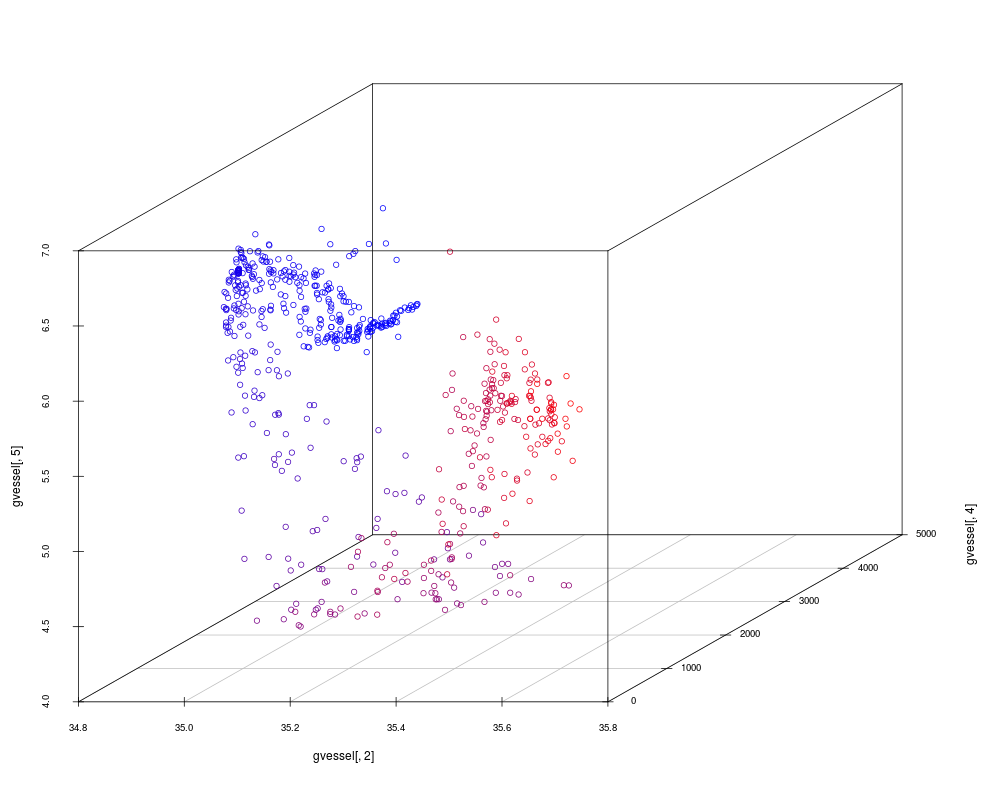
SourceRetrieved by B. Powell from the World Ocean Database, http://www.nodc.noaa.gov/OC5/WOD/pr_wod.html. ReferencesEinbeck, J., Evers, L., and Powell, B. (2010): Data compression and regression through local principal curves and surfaces, International Journal of Neural Systems, 20, 177-192. Examplesdata(gvessel) pairs(gvessel[,c(3,2,4,5)]) tcol <- (gvessel$tempg- min(gvessel$tempg))/(max(gvessel$tempg)- min(gvessel$tempg)) require(scatterplot3d) scatterplot3d(gvessel[,2],gvessel[,4],gvessel[,5], color=rgb(tcol,0,1-tcol)) Results
R version 3.3.1 (2016-06-21) -- "Bug in Your Hair"
Copyright (C) 2016 The R Foundation for Statistical Computing
Platform: x86_64-pc-linux-gnu (64-bit)

R is free software and comes with ABSOLUTELY NO WARRANTY.
You are welcome to redistribute it under certain conditions.
Type 'license()' or 'licence()' for distribution details.

R is a collaborative project with many contributors.
Type 'contributors()' for more information and
'citation()' on how to cite R or R packages in publications.

Type 'demo()' for some demos, 'help()' for on-line help, or
'help.start()' for an HTML browser interface to help.
Type 'q()' to quit R.

> library(LPCM)
> png(filename="/home/ddbj/snapshot/RGM3/R_CC/result/LPCM/gvessel.Rd_%03d_medium.png", width=480, height=480)
> ### Name: gvessel
> ### Title: North Atlantic Water Temperature Data.
> ### Aliases: gvessel
> ### Keywords: datasets
>
> ### ** Examples
>
> data(gvessel)
> pairs(gvessel[,c(3,2,4,5)])
> tcol <- (gvessel$tempg- min(gvessel$tempg))/(max(gvessel$tempg)- min(gvessel$tempg))
> require(scatterplot3d)
Loading required package: scatterplot3d
> scatterplot3d(gvessel[,2],gvessel[,4],gvessel[,5], color=rgb(tcol,0,1-tcol))
>
>
>
>
>
> dev.off()
null device
          1
>
|