Supported by Dr. Osamu Ogasawara and  . . |
|
Last data update: 2014.03.03 |
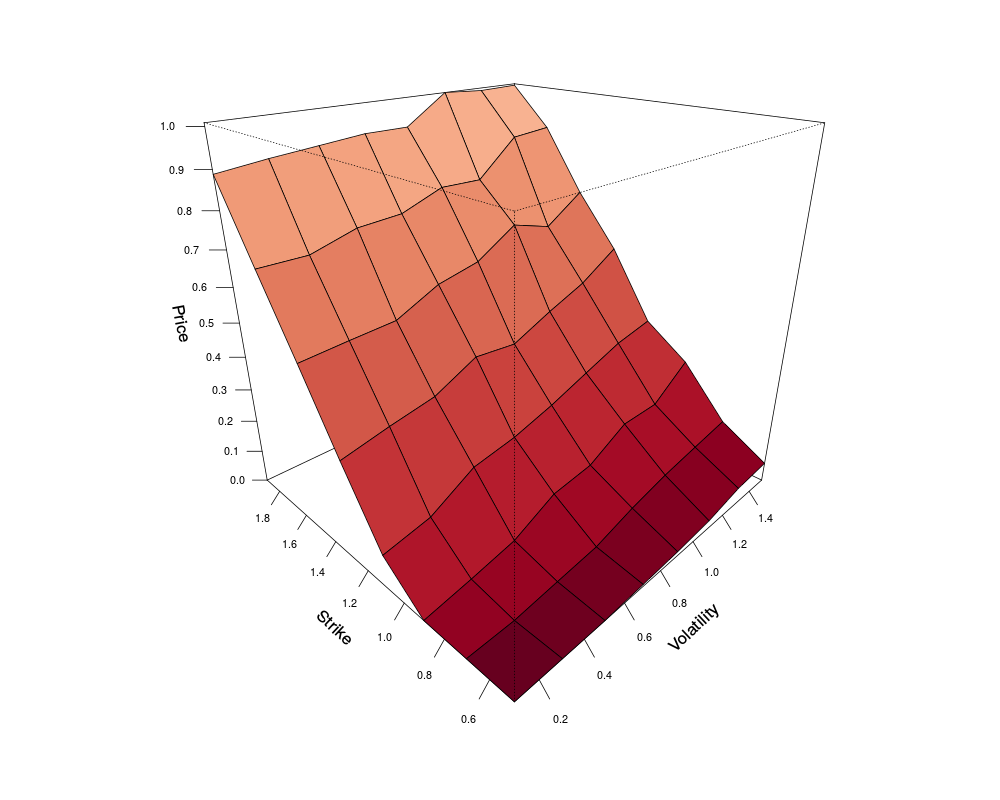
Deriving a table of Asian American put prices at different volatilities and strikesDescriptionThe function calculates the prices at different volatilities and strikes using the UsageAsianAmerPutLSMPriceSurf(Spot = 1, vols = (seq(0.1, 2, 0.1)), n = 1000, m = 365, strikes = (seq(0.5, 2.5, 0.1)), r = 0.06, dr = 0, mT = 1) Arguments
ValueThe function returns an object of the class PriceSurface that is a matrix of prices at different volatilities and strikes. Class-specific Author(s)Mikhail A. Beketov See AlsoFunctions: Examplessurface<-AsianAmerPutLSMPriceSurf(vols = (seq(0.1, 1.5, 0.2)), n=200, m=10, strikes = (seq(0.5, 1.9, 0.2))) summary(surface) plot(surface, color = divPalette(150, "RdBu")) Results
R version 3.3.1 (2016-06-21) -- "Bug in Your Hair"
Copyright (C) 2016 The R Foundation for Statistical Computing
Platform: x86_64-pc-linux-gnu (64-bit)

R is free software and comes with ABSOLUTELY NO WARRANTY.
You are welcome to redistribute it under certain conditions.
Type 'license()' or 'licence()' for distribution details.

R is a collaborative project with many contributors.
Type 'contributors()' for more information and
'citation()' on how to cite R or R packages in publications.

Type 'demo()' for some demos, 'help()' for on-line help, or
'help.start()' for an HTML browser interface to help.
Type 'q()' to quit R.

> library(LSMonteCarlo)
Loading required package: mvtnorm
Loading required package: fBasics
Loading required package: timeDate
Loading required package: timeSeries


Rmetrics Package fBasics
Analysing Markets and calculating Basic Statistics
Copyright (C) 2005-2014 Rmetrics Association Zurich
Educational Software for Financial Engineering and Computational Science
Rmetrics is free software and comes with ABSOLUTELY NO WARRANTY.
https://www.rmetrics.org --- Mail to: info@rmetrics.org
> png(filename="/home/ddbj/snapshot/RGM3/R_CC/result/LSMonteCarlo/AsianAmerPutLSMPriceSurf.Rd_%03d_medium.png", width=480, height=480)
> ### Name: AsianAmerPutLSMPriceSurf
> ### Title: Deriving a table of Asian American put prices at different
> ###   volatilities and strikes
> ### Aliases: AsianAmerPutLSMPriceSurf
> ### Keywords: Monte Carlo Option pricing American put
>
> ### ** Examples
>
> surface<-AsianAmerPutLSMPriceSurf(vols = (seq(0.1, 1.5, 0.2)), n=200, m=10,
+ strikes = (seq(0.5, 1.9, 0.2)))
> summary(surface)

Volatility sequence:
0.1 0.3 0.5 0.7 0.9 1.1 1.3 1.5

Strike sequence:
0.5 0.7 0.9 1.1 1.3 1.5 1.7 1.9

Average price: 0.3909562
Minimum price: 0
Maximum price: 1.074814> plot(surface, color = divPalette(150, "RdBu"))
>
>
>
>
>
> dev.off()
null device
          1
>
|