Supported by Dr. Osamu Ogasawara and  . . |
|
Last data update: 2014.03.03 |
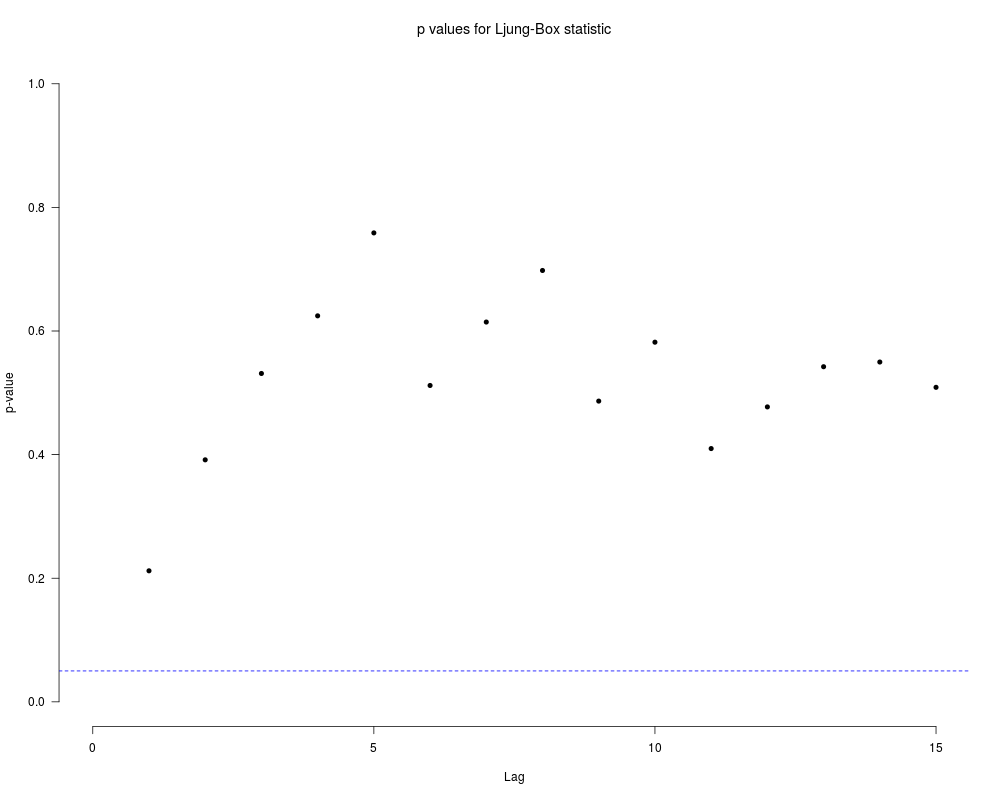
Ljung-Box Test PlotDescriptionReturns plot of the p-values Ljung-Box test. UsageBox.Ljung.Test(z, lag = NULL, main = NULL) Arguments
DetailsThe Ljung-Box test is used to check if exists autocorrelation in a time series. The statistic is Q = n(n+2)cdot∑_{j=1}^h hat{ρ}(j)^2/(n-j) with n the number of observations and hat{ρ}(j) the autocorrelation coefficient in the sample when the lag is j.
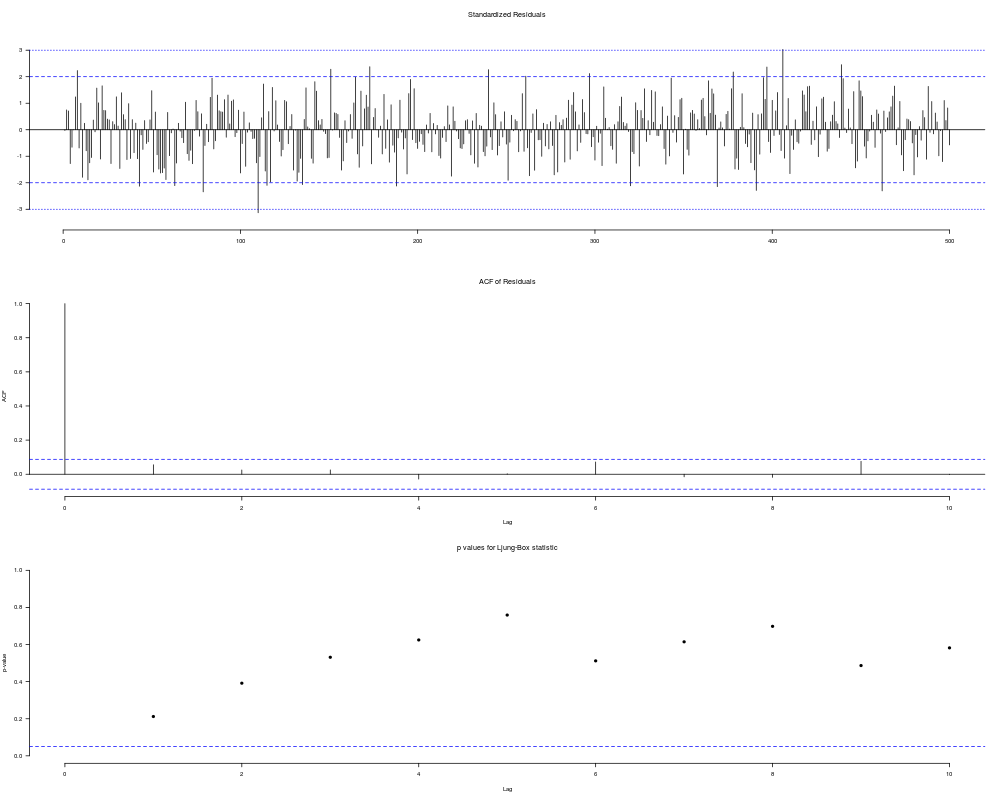
Author(s)Ricardo Olea <raolea@uc.cl> ReferencesBrockwell, Peter J., and Richard A. Davis. Introduction to time series and forecasting. 2002. ISBN-13: 978-0387953519. Ljung, G.M. and Box, G.E.P. (1978), On a measure of lack of fit in time series models, Biometrika, 65, 297-303. Examplesz = rnorm(500) Box.Ljung.Test(z, lag=15) ts.diag(z) Results
R version 3.3.1 (2016-06-21) -- "Bug in Your Hair"
Copyright (C) 2016 The R Foundation for Statistical Computing
Platform: x86_64-pc-linux-gnu (64-bit)

R is free software and comes with ABSOLUTELY NO WARRANTY.
You are welcome to redistribute it under certain conditions.
Type 'license()' or 'licence()' for distribution details.

R is a collaborative project with many contributors.
Type 'contributors()' for more information and
'citation()' on how to cite R or R packages in publications.

Type 'demo()' for some demos, 'help()' for on-line help, or
'help.start()' for an HTML browser interface to help.
Type 'q()' to quit R.

> library(LSTS)
> png(filename="/home/ddbj/snapshot/RGM3/R_CC/result/LSTS/Box.Ljung.Test.Rd_%03d_medium.png", width=480, height=480)
> ### Name: Box.Ljung.Test
> ### Title: Ljung-Box Test Plot
> ### Aliases: Box.Ljung.Test
> ### Keywords: Ljung Box timeseries
>
> ### ** Examples
>
> z = rnorm(500)
> Box.Ljung.Test(z, lag=15)
> ts.diag(z)
>
>
>
>
>
> dev.off()
null device
          1
>
|