Supported by Dr. Osamu Ogasawara and  . . |
|
Last data update: 2014.03.03 |
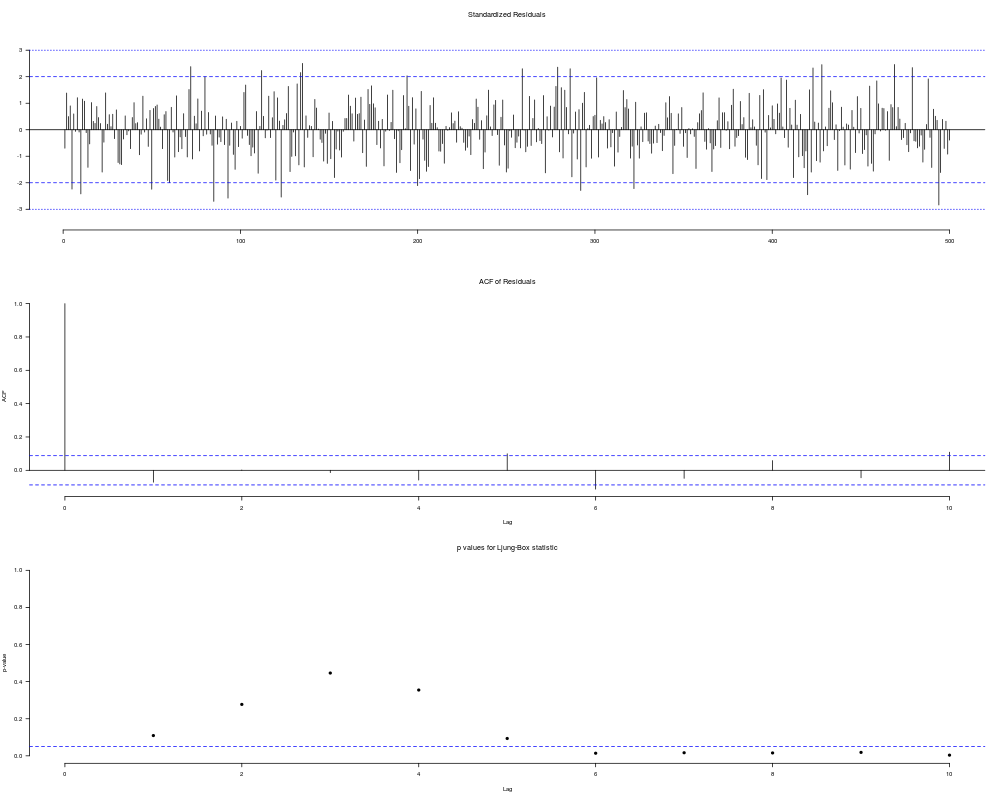
Diagnostic Plots for Time Series fitsDescriptionPlot time-series diagnostics. Usagets.diag(x, lag = 10, cex = 0.5) Arguments
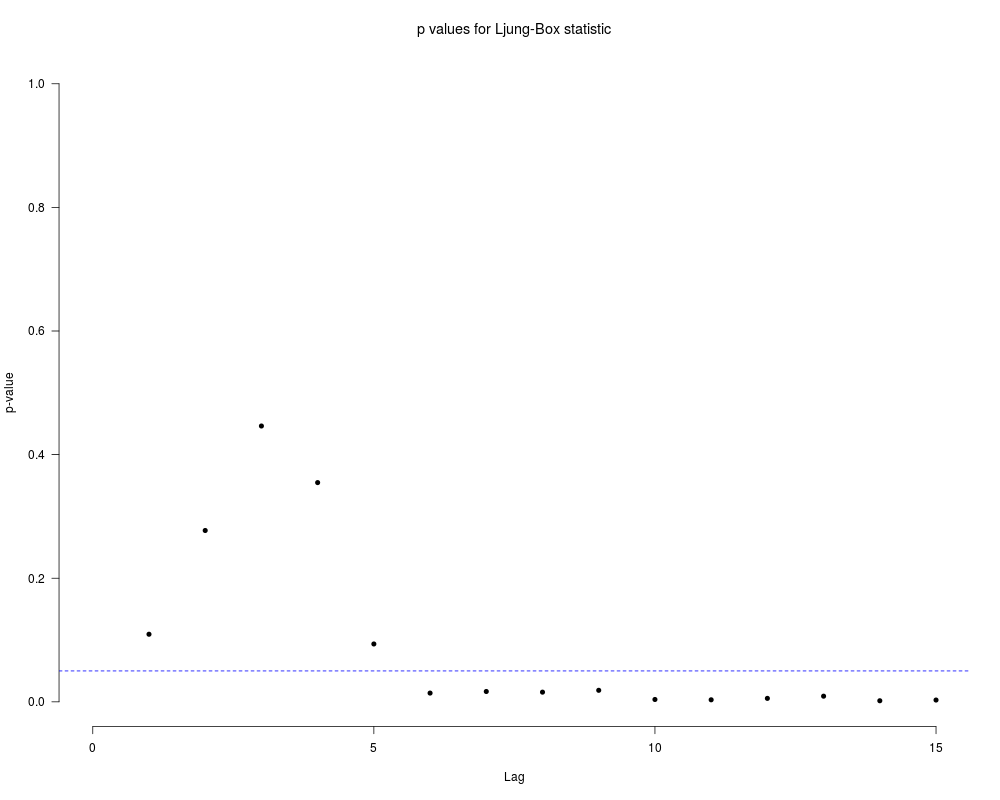
DetailsThis function plot the residuals, the autocorrelation function of the residuals (ACF) and the p-values of the Ljung-Box Test for all lags up to ValueDiagnostics are plotted. Author(s)Ricardo Olea <raolea@uc.cl> Examplesz = rnorm(500) Box.Ljung.Test(z, lag=15) ts.diag(z) Results
R version 3.3.1 (2016-06-21) -- "Bug in Your Hair"
Copyright (C) 2016 The R Foundation for Statistical Computing
Platform: x86_64-pc-linux-gnu (64-bit)

R is free software and comes with ABSOLUTELY NO WARRANTY.
You are welcome to redistribute it under certain conditions.
Type 'license()' or 'licence()' for distribution details.

R is a collaborative project with many contributors.
Type 'contributors()' for more information and
'citation()' on how to cite R or R packages in publications.

Type 'demo()' for some demos, 'help()' for on-line help, or
'help.start()' for an HTML browser interface to help.
Type 'q()' to quit R.

> library(LSTS)
> png(filename="/home/ddbj/snapshot/RGM3/R_CC/result/LSTS/ts.diag.Rd_%03d_medium.png", width=480, height=480)
> ### Name: ts.diag
> ### Title: Diagnostic Plots for Time Series fits
> ### Aliases: ts.diag
> ### Keywords: diagnostic ljung acf residuals timeseries
>
> ### ** Examples
>
> z = rnorm(500)
> Box.Ljung.Test(z, lag=15)
> ts.diag(z)
>
>
>
>
>
> dev.off()
null device
          1
>
|
Created & Maintained by Osamu Ogasawara (osamu.ogasawara@gmail.com) and 